

Multiple Timeframes Analysis Guide
Forex trading is the place where all types of traders gather to speculate on the value of a currency. Currencies are paired against one another, and the Forex dashboard shows all the currency pairs available to trade at any given broker.
A currency pair moves on pips, and a pip is the fourth digit in a quotation. When traders make a pip, they realize a profit or mark a loss when losing a pip.
From this point of view, Forex trading is similar with trading other markets. When traders believe the price of a security will rise, they’ll buy that financial product. Or, sell it if the analysis points to the downside.
To sell or buy something, traders make an analysis. Either economic (traders analyze the two economies present in the currency pair and decide what to buy or sell) or technical, the analysis is the reason for which the buying or selling happens.
Trading in the 21st century uses sophisticated trading platforms and computers to draw a chart. With a single mouse click, traders have access to a plethora of technical instruments easy to use and interpret.
But most of the trading tools and theories were invented on the stock market, many decades ago. At that point in time, computers didn’t exist to help traders form an overall picture about the market.
However, even though it took more time, and was far more difficult to document patterns, one of the most exciting ways to look at the markets originated decades ago. This is the concept of a multiple timeframe analysis.
Top-Down Analysis Explained
Elliott was the first one to discover the power of multiple timeframe analysis. The Elliott Waves Theory covers cycles in a way never done before, and the cycles of different degrees are the equivalent of today’s timeframes that we can see on any trading platforms.
Elliot spoke about super-cycles, grand-cycles, and then fractured the analysis on smaller cycles. In the world of today’s trading platforms, these cycles correspond to the monthly, weekly, daily, four-hour, hourly, and other various timeframes.
The secret to using and counting different cycles with the Elliott Waves Theory is to start from the larger more significant timeframe and then move in locked steps towards the smaller ones.
So let’s give it a try now that we know plenty about the Elliott Waves Theory and what impulsive and corrective waves are. If in doubt, just refer to the previous articles explaining various Elliott Waves concepts.
Monthly as Part of the Big Picture
Even the monthly chart is a good-enough timeframe to trade. While for many it may sound irrational to open a trade based on the monthly chart analysis, with the help of money management, anything is possible.
Let’s use the USDCAD in our journey to explain the multiple timeframe analysis through the eyes of the Elliott Waves Theory. Any analysis starts from the left to right, so this is what we should do starting on the monthly chart.
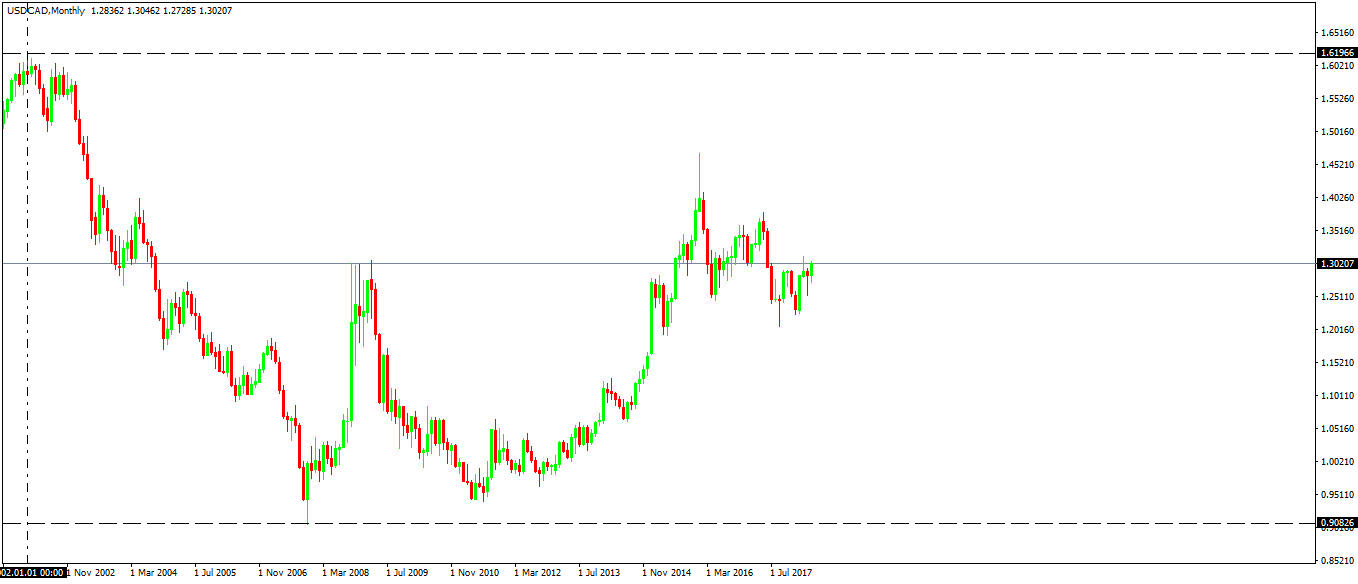
After marking the top and the bottom with two horizontal lines and then the starting point with one vertical line, traders need to answer one question: is the move that followed, a bearish, impulsive or corrective one.
We know by now that an impulsive wave has one extended wave that should stand out from the crowd. So, the question to answer here is the following: is the drop from around 1.60 to below parity (the main swing lower), impulsive or corrective? Because there is no extension visible, we can only assume it is a corrective wave.
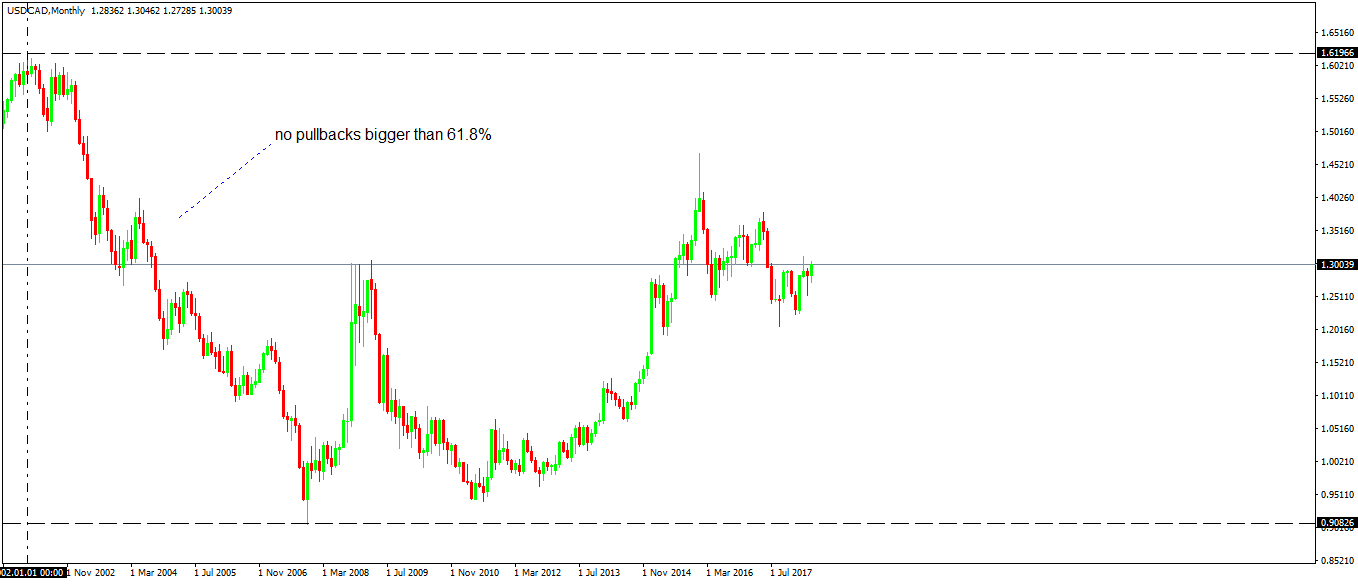
The logical process moves forward to what type of a correction is it: simple or complex? To answer that, traders look at the pullbacks in the bearish trend. If any one pullback exceeds 61.8% retracement of the previous swing, the market forms a flat pattern. If not, it forms a zigzag or a complex correction that starts with a zigzag.
Looking at the chart above, it would mean that the pair created a zigzag family pattern, and judging by the price action at the bottom, it looks like a double combination that ended with a triangle. Because the monthly is the biggest timeframe possible, this is the biggest cycle, so traders use characters to point out the highest cycle degree that exists.
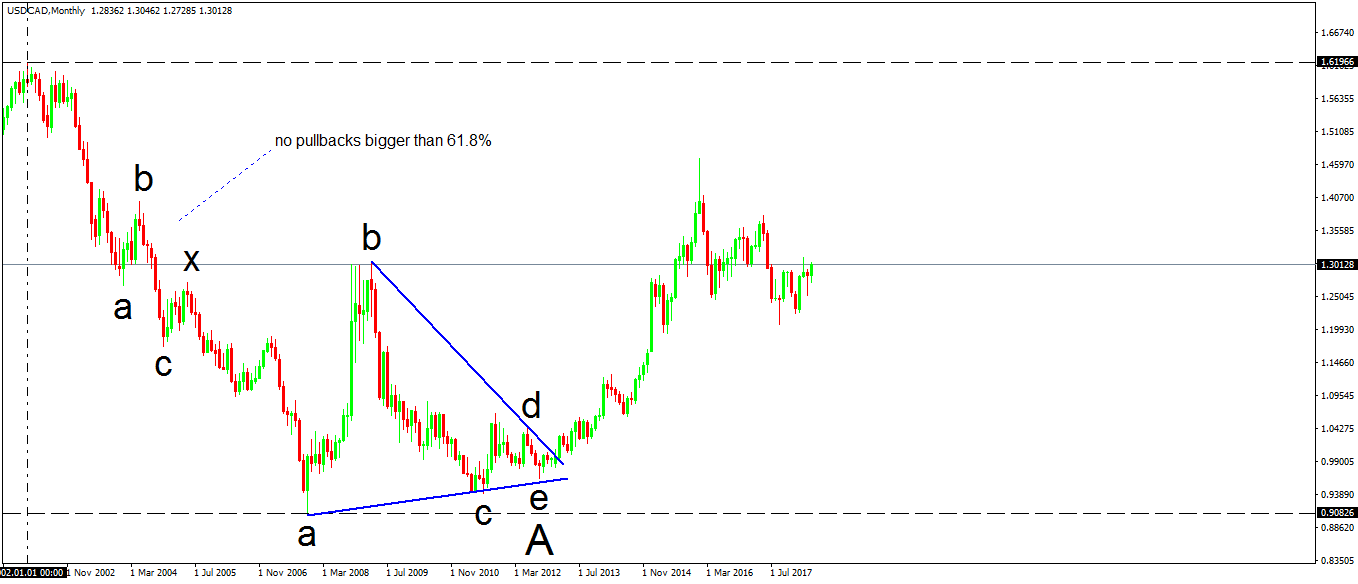
This is how the double combination looks like, and this is how the monthly timeframe should remain. Moving on the lower timeframes, traders take the logical process to the next level.
Namely, if the move lower is a corrective wave, it cannot be the A-wave of a zigzag (that’s always impulsive), but of a flat. Hence, the B-wave of the same degree should follow after the triangle’s formation, and the minimum retracement level is 61.8%.
To find it and to label the move, the logical step is to go on the lower timeframe (the weekly). However, we shouldn’t count anymore on the weekly timeframe what we already counted on the monthly.
Instead, we should merely mark the end of the previous wave so that we know where to start the count and take on the lower timeframe all the relevant information we can from the bigger one.
Hence, we take the 61.8% level as the target after the triangle broke higher and the end of the previous A-wave.
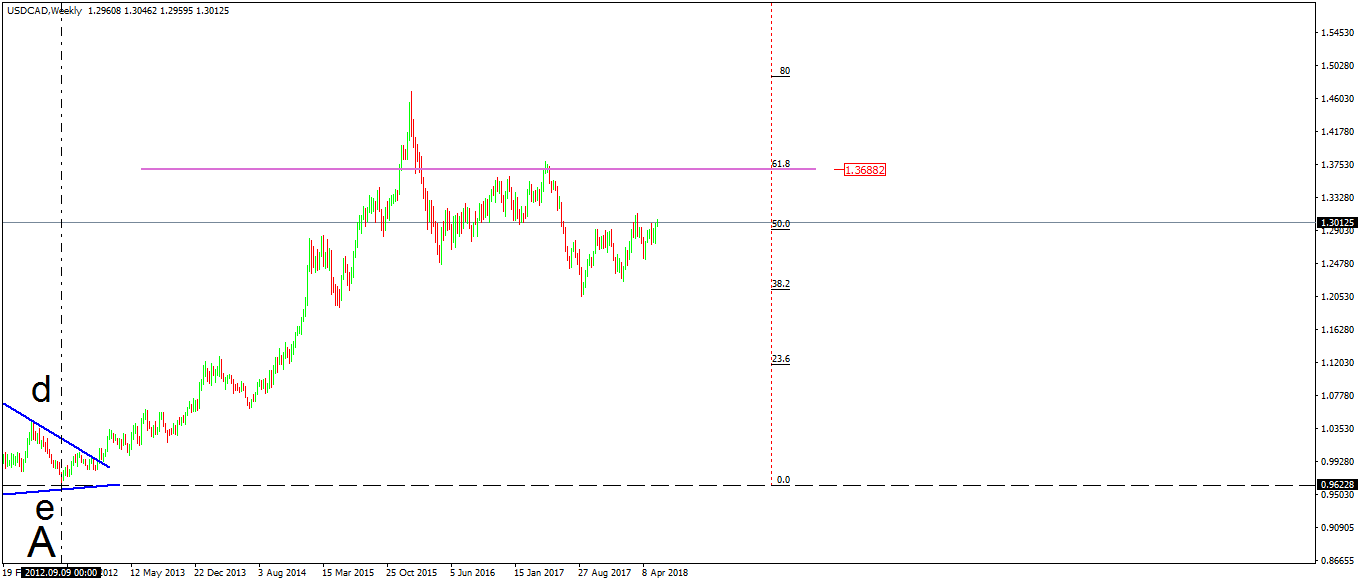
A simple look on the left side of the chart above tells you that:
- the previous timeframe ended with a triangle
- most likely that’s the end of wave A of a bigger degree
- the pullback to follow most likely exceeds 61.8% of the entire A-wave
Armed with this information, traders continue the multiple timeframes analysis or the top/down analysis by going on even lower timeframes like daily and four-hour to count the structure until the 61.8% level is reached.
We won’t do that here, but the point is that a multiple timeframe analysis brings discipline in trading.
Moreover, counting waves on lower and even lower degrees may result in different trades on the same currency pair with different targets. Some shorts and some longs too.
For example, a quick look at the move that followed the triangle showed the retracement to the 61.8% took place, but it wasn’t a straight line. In fact, for several weeks, the market corrected in strong bearish trends visible on the lower timeframes. This brings a window of opportunity to partially or fully hedge a trading account and take advantage of the insights offered by the top/down analysis approach.
Conclusion
We used the Elliott Waves Theory to illustrate the multiple timeframe concepts, but the same thing applies to other technical analysis concepts. For instance, wedges or divergences with an oscillator.
The key is to use the same strategy on all timeframes, and proper risk-reward ratios and money management rules. Rules like never risking more than one percent of the trading account on any given trade, hedging when possible, 1:3 risk-reward ratio, would only help the account grow and to help traders get a complete vision of the overall price action.
Because of the different time horizon, things like positive or negative swaps have the potential to influence the overall profitability. Hence, they are an integer part of the analysis process, as traders using such approaches can be scalpers, swing traders and investors too.