

Bill Williams Indicators Explained
One of the most important technical traders of all times, Bill Williams was born in the United States in 1932. To this day, his contribution to technical analysis remains one that revolutionized the way traders approach financial markets.
He was also a pioneer of market psychology, dedicating years to studying and building the chaos theory.
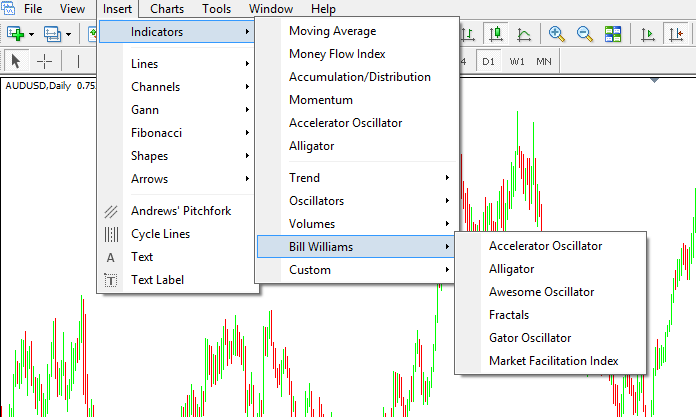
He studied the stock market, but the indicators he developed are now an integer part of any trading platform. In Forex trading, they work as in any other market, and the MetaTrader4 platform even has a particular tab comprising the Williams indicators.
This article aims to explain the indicators and to show their potential in Forex trading, as well as any limitations.
Forex Trading with the Accelerator and Awesome Oscillators
The Accelerator Oscillator is an oscillator derived from another one of Bill Williams oscillators: the Awesome Oscillator. More precisely, it is the difference between the Awesome oscillator and the five-period moving average.
Hence, the way to trade with the two oscillators is similar, and if applied on the same chart, they look like this:
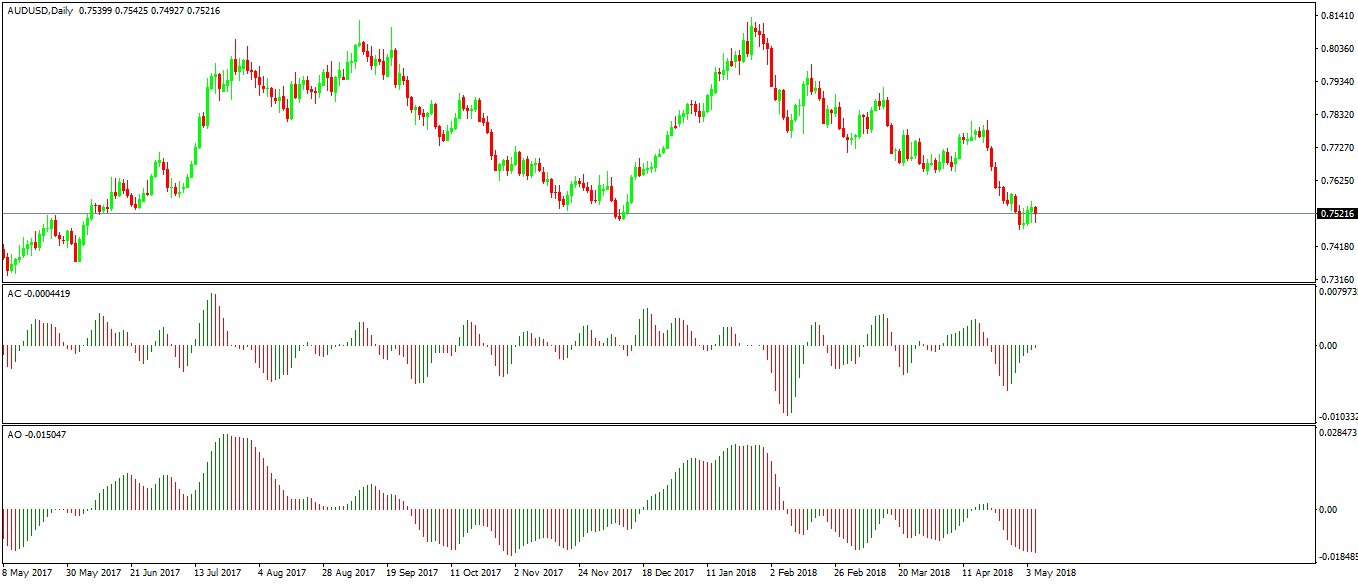
They both travel into the positive and negative territory, and the zero level makes the difference between bullish and bearish conditions.
When the two oscillators plot a line higher than the previous one, the color turns green. Otherwise, it remains red.
Traders can use the Accelerator and the Awesome Oscillator either separately or together, both in continuation and reversal patterns.
The most popular way to trade with the two is to use them as a continuation pattern when they cross the zero level.
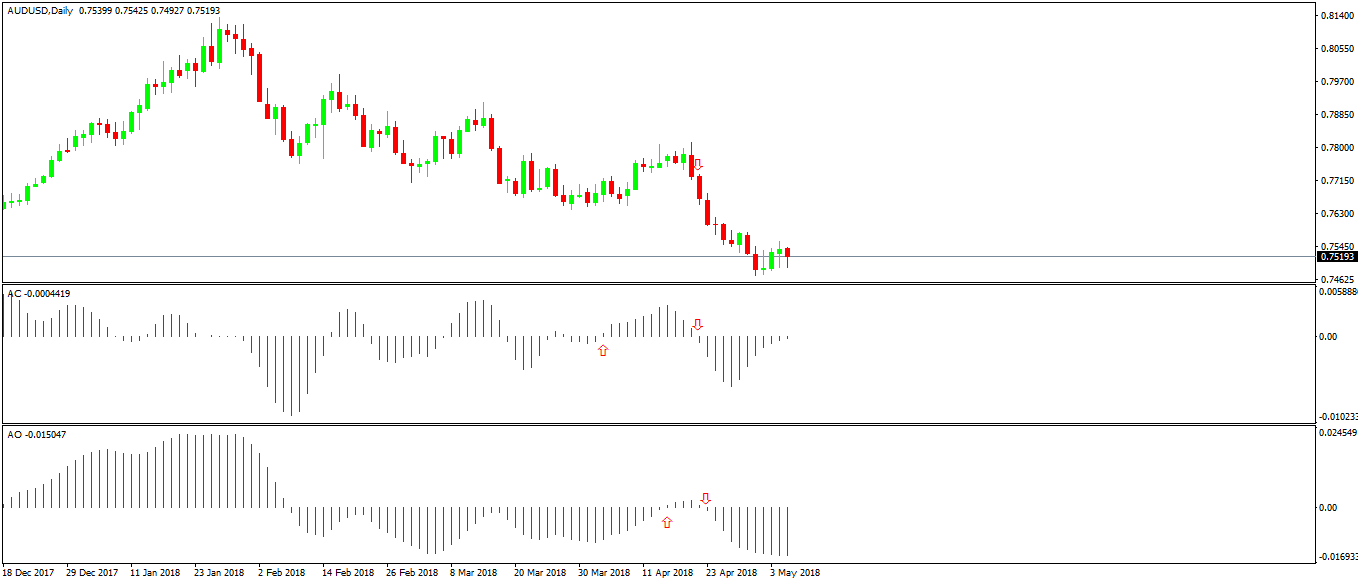
As you can see, the Awesome Oscillator lags the Accelerator using this strategy, but this depends on each trading setup. Sometimes the best thing to do is to wait until both are aligned in the same direction, before deciding to buy or sell. Just like the second trade on the chart above.
Some traders look for divergences between the price and the two oscillators, and only trade divergences that form on both of them.
The Alligator – A Trend-Following Indicator in Forex Trading
Because it is a trend indicator, it appears on the actual chart, and not in a separate window. Very popular among Forex traders, the Alligator uses three lines named jaws, teeth and lips, suggesting the strength of each regarding support and resistance.
If the price moves beyond jaws, trending conditions don’t exist anymore. In earnest, the three lines are smoothed moving averages at five, eight and thirteen periods. Note here that the three numbers belong to the Fibonacci series. It is likely that the Fibonacci numbers played an essential role in the overall development of the Alligator indicator.
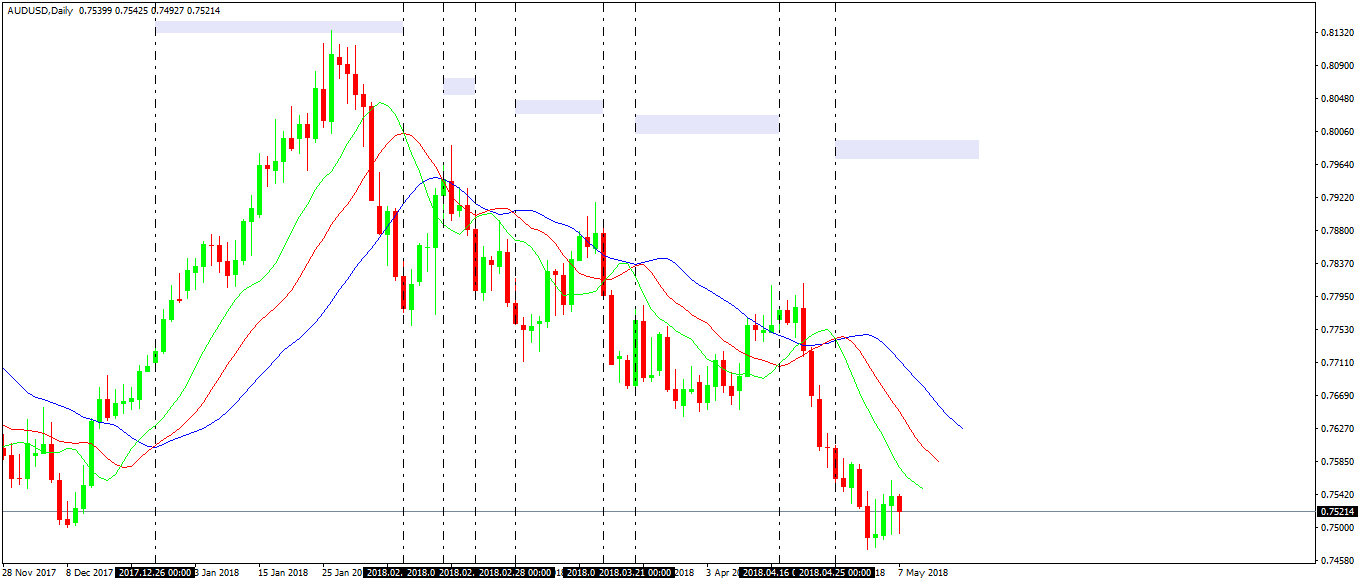
The idea is to find the period when the three lines are aligned. That shows trending conditions and, according to Bill Williams, the Alligator is “eating with its mouth open,” just like the first instance in the AUDUSD daily chart from above.
Fractals in Forex Trading
The concept of a fractal in Forex trading is the one that gets as close as possible to the chaos theory. According to the original idea, a fractal shows a top or a bottom that the market makes.
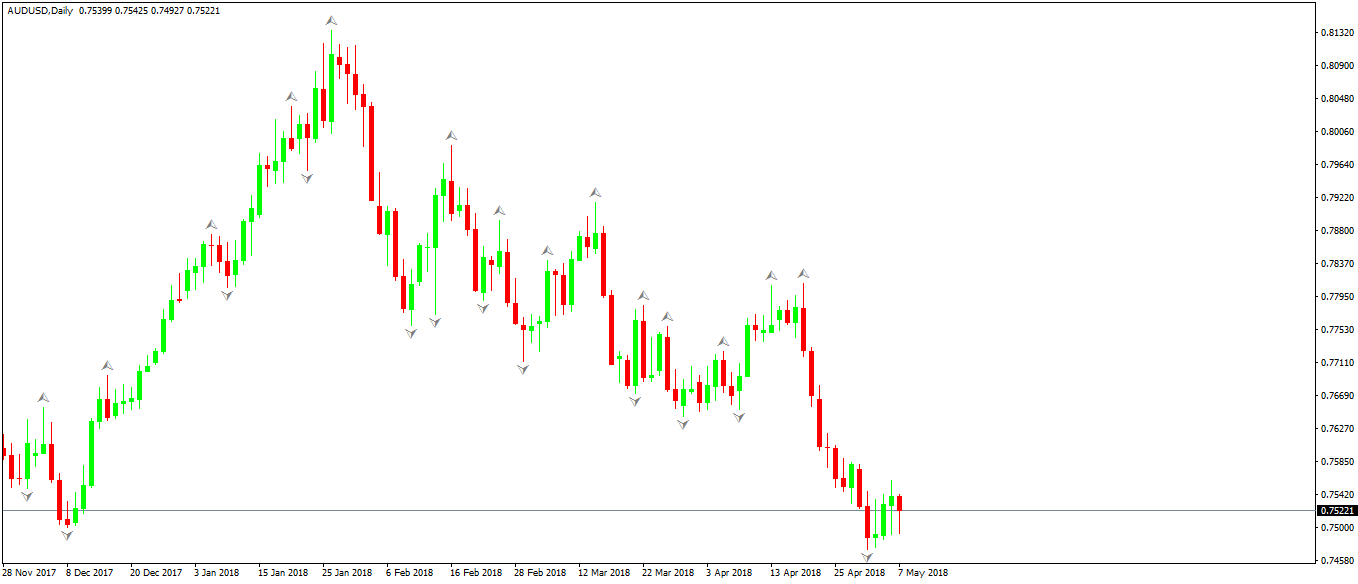
The fractals appear as small triangles or arrows above or below a candle. Effectively, for an arrow to appear on the screen, the indicator considers a minimum of five consecutive periods or candles.
Fractals that appear on top of the candles are named “up fractals,” showing bearish conditions. For an up fractal, the market needs to respect the following conditions:
- the left of the up fractal has two candles making higher highs
- the fractal blasting through the second higher high
- a series of a minimum two candles that make lower lows form on the right of it
Fractals that appear at the bottom of the candles are named “down fractals,” showing bullish conditions. For an down fractal, the market needs to respect the following conditions:
- the left of the down fractal has two candles making lower lows
- the fractal exceeds the second lower low
- a series of minimum two candles that make higher highs form on the right of it
Some trading platforms allow traders to alter the number of candles the indicator considers. As a rule of thumb, the bigger the period considered, the more reliable the fractal reversal becomes.
One of the main problems of the fractal indicator is that it repaints. In technical analysis, repainting refers to an indicator showing something, only for it to disappear from the chart with the upcoming candles.
For this reason, to make sure the fractal won’t “disappear” from the screen, traders must wait for the closing of the second candle after the fractal’s appearance.
Forex Trading with the Gator Oscillator
The gator oscillator plots a histogram at the bottom of a chart, showing what the Alligator indicator does. It is a better visualization of the Alligator’s changes while freeing up the chart for integration with other indicators or trading theories.
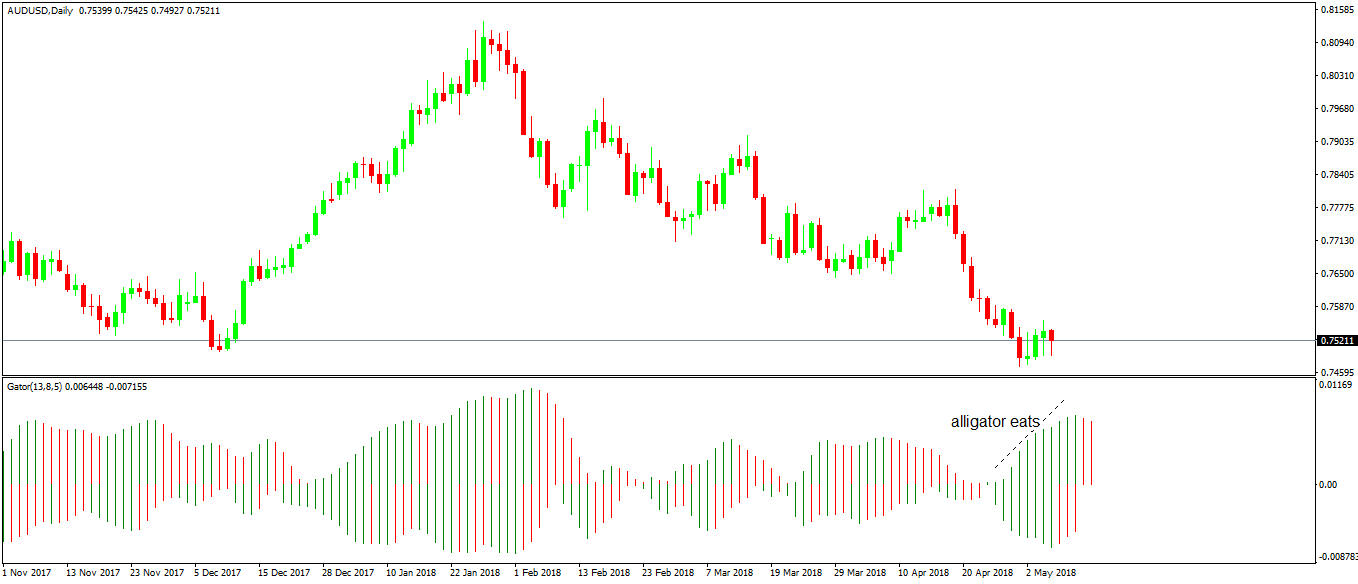
The oscillator revolves around the zero level and the main idea behind trading it is to compare the bars below and above it.
When both bars are green, it is said that the alligator eats, or the market trends, just like the AUDUSD daily chart did for the last week.
When lines above and below the zero level are red, the alligator sleeps. No trending conditions exist.
Needless to say, the key is to find out when the alligator awakes. A tip is to look for low values in the bars around the zero level and with different colors.
Market Facilitation Index (MFI) in Forex Trading
A tricky indicator, the MFI computes the price movement per unit of volume. We mentioned here in our trading academy already that volume indicators in Forex trading aren’t that reliable as the volume doesn’t refer to the entire market.
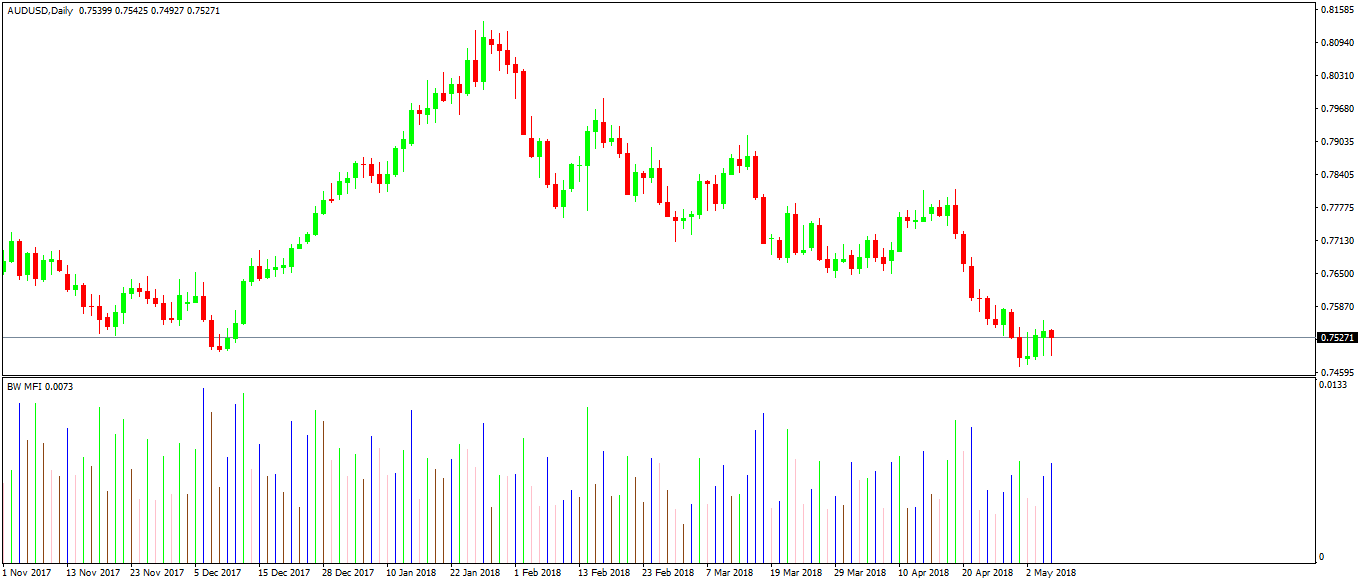
The MFI plots candles of different colors at the bottom of a chart. Each color signals something, and traders use them to open or close trades.
Here’s the color code’s explanation:
- green bars show when the volume rises and the price moves, hence it is better to align the trades with the general market movement;
- brown bars show a weakening momentum
- blue bars show a fake move, with price moving but the volume is low
- -pink bars show the price moves stall, but the volume is on the rise.
Conclusion
Bill Williams had a tremendous contribution to technical analysis. His indicators are popular in Forex trading as they show both trending and reversal conditions.
Moreover, when used together (like in the case of the Accelerator and the Awesome oscillators), they tend to provide more reliable signals.