

Divergences with the Momentum Indicator
One of the most common oscillators on all trading platforms, the Momentum is an indicator that deserves a trader’s full attention. While most oscillators show overbought and oversold levels, in Forex trading Momentum differs both in construction and in interpretation.
The MetaTrader4 or MT4 platform offers the Momentum indicator under the oscillator’s category.
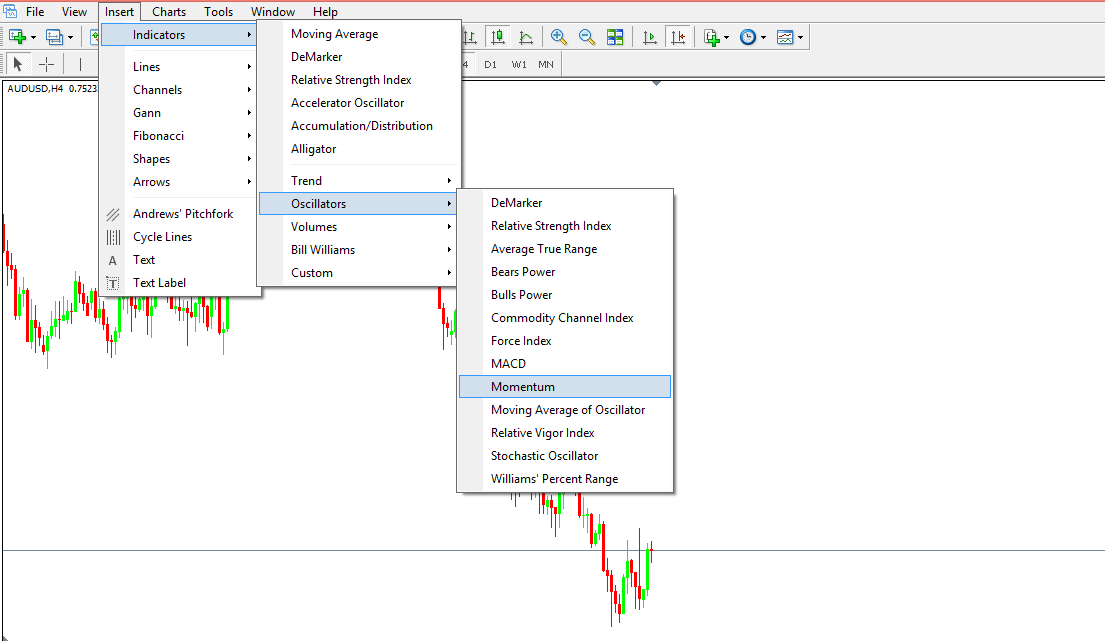
Together with the Relative Strength Index (RSI) or the Commodity Channel Index (CCI), the Momentum is widely used in Forex trading. Sometimes, traders use similar strategies to trade with all oscillators and focus on differences between two or more of them.
While such a strategy may work, it shows random results in the long run. The problem is that not all oscillators are the same, despite traders using the same period for all.
Take Momentum for a change. It is a speed indicator, in the sense that it shows the strength of a trend. It is the closest indicator that exists to measuring the price action, one of the essential features of a trending market.
When Momentum falters, the trend has lost its strength. Either the London and New York sessions end, or there is a bank holiday, etc., there are plenty of reasons for the Momentum to stall. When that happens, expect the trending conditions to disappear and consolidation to start.
For that, the Momentum is one of the tremendous technical tools to use with trending and ranging markets. Those of you that followed the articles closely in our Trading Academy are familiar with the ranging and trending nature of the markets.
In Forex trading, most oscillators show overbought and oversold levels, but the key is to use them only in ranging markets. What if there’s an oscillator/indicator that tells us when the market is in a range and when not?
Introducing the Momentum indicator.
Momentum in Forex Trading
Like any oscillator, the Momentum indicator appears in a small window at the bottom of the main chart. It refers to the closing price of two different candles:
- one candle is the most recent one, or the previous one that recently closed
- another candle is one that traders can choose from the past. It can be customized, in the sense that when we select the settings for the Momentum indicator, the default value for the period (at least with the MT4 platform) is 14, meaning the Momentum compares the closing price of the previous candle with the closing price 14-periods ago.
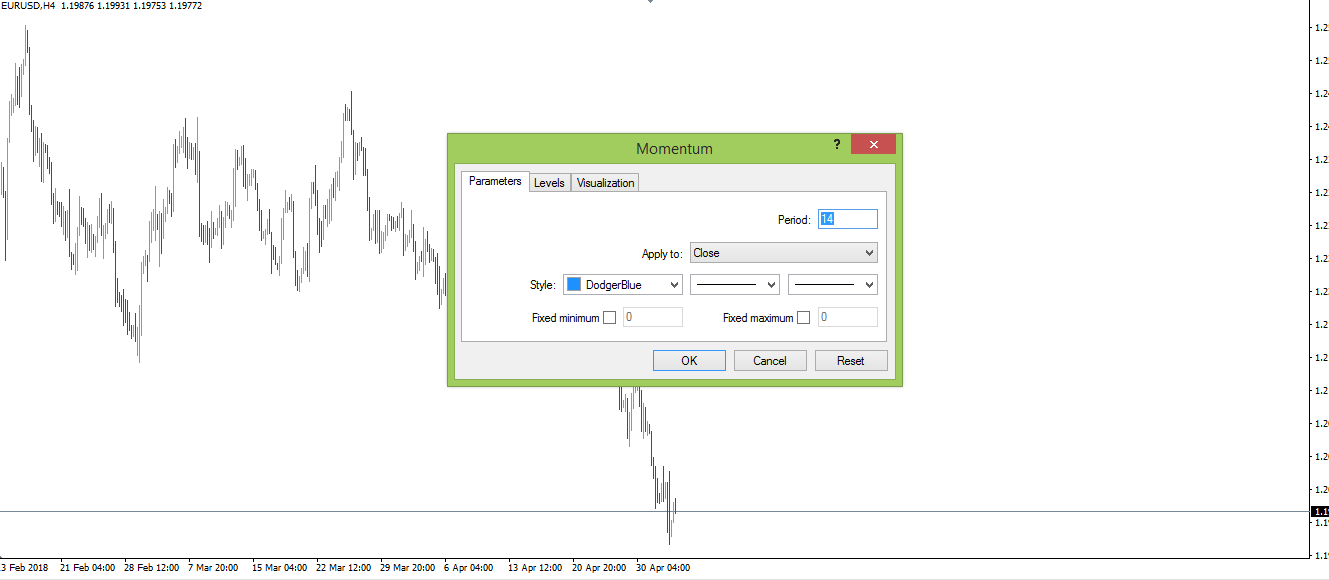
It is entirely up to the trader to change the default setting, but we’ll use the 14-period standard setting to point out the best use of the Momentum indicator in Forex trading. Depending on the comparison between the two prices, the Momentum indicator has different variations, but in the end, it ends up showing the same thing: the strength of a trend.
The Equilibrium Point for the Momentum Indicator
When applied on any given chart, the Momentum indicator travels around the 100 level. While not explicitly marked, the 100 level is the equilibrium point, as it shows:
- the closing price of the previous candle is higher than the closing price of the candle 14-period ago – meaning the Momentum >100
- the closing price of the last candle is lower than the closing price of the candle 14-period ago – meaning the Momentum <100
Hence, it differentiates between ranging and trending markets, or bullish and bearish. Applied on any given chart, it looks like this:
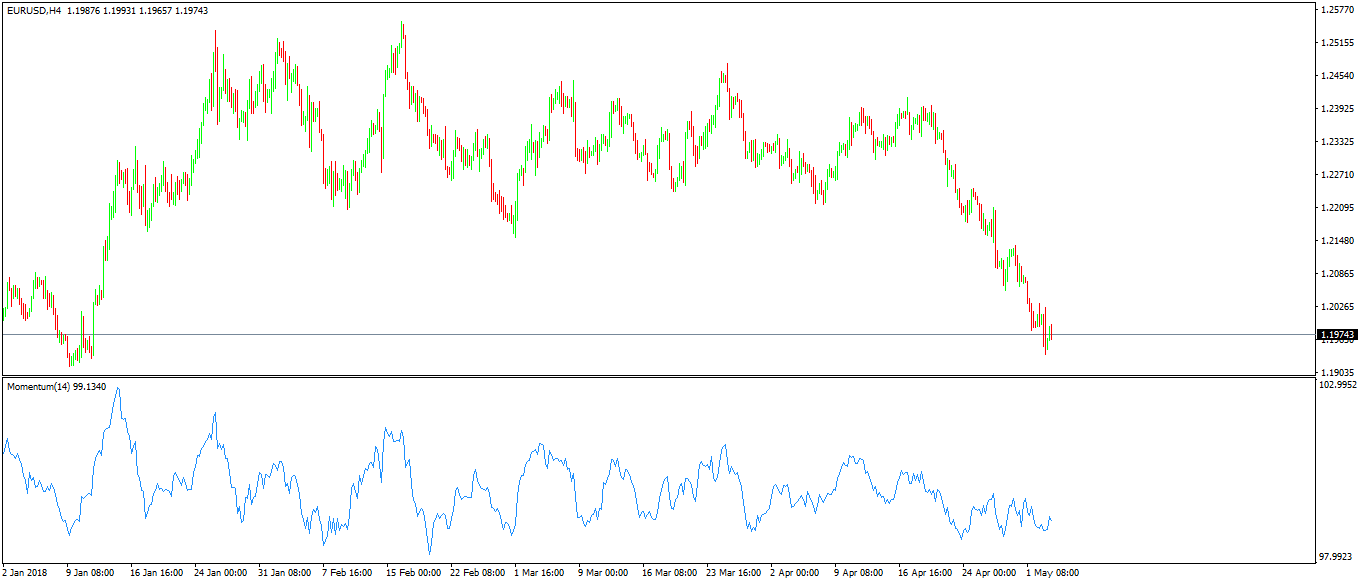
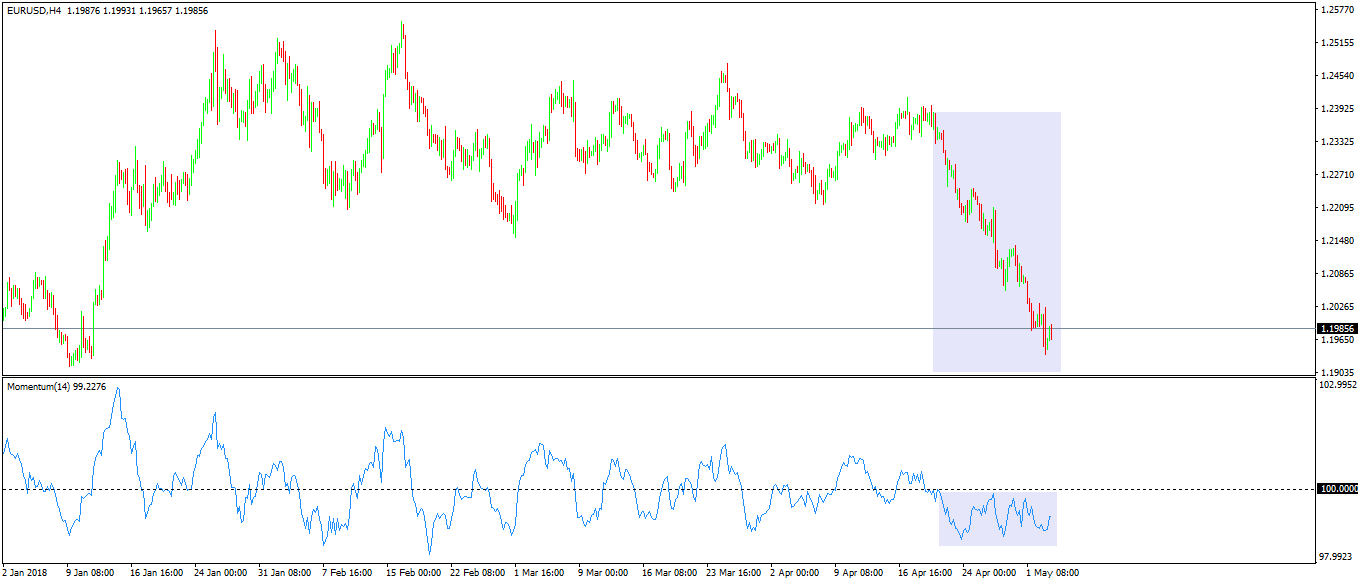
Above is the recent EURUSD four-hour chart, with the MoM(14) at the bottom of it. As you can see, the 100 level is not present, but that is an easy fix by just adding a horizontal line at the desired level :
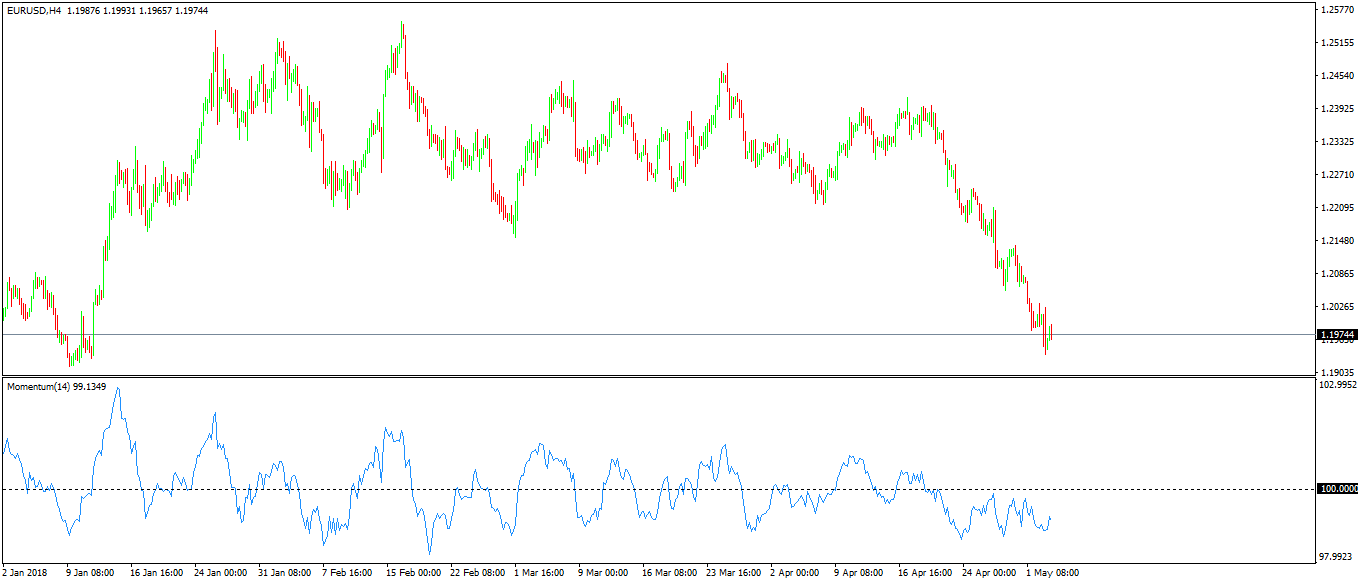
At this moment, the Momentum indicator “speaks” a different language. Keep in mind the interpretation: it shows the strength of the movement, used to spot ranging and trending markets.
Put simply: a bullish trend won’t stop if Momentum sits >100, and a bearish trend won’t reverse if Momentum is <100. Check the recent drop the EURUSD made, from the 1.24 all the way to the current 1.19.
For the entire dip, the Momentum stood below the 100 level, showing no reversal yet possible. The fall below 100 corresponds to the whole drop in the EURUSD pair.
Divergences with the Momentum Indicator
Because it shows the strength or speed of a trend, the Momentum indicator is a great tool to use to spot divergences with the price. Or, simply put, to detect fake moves in Forex trading.
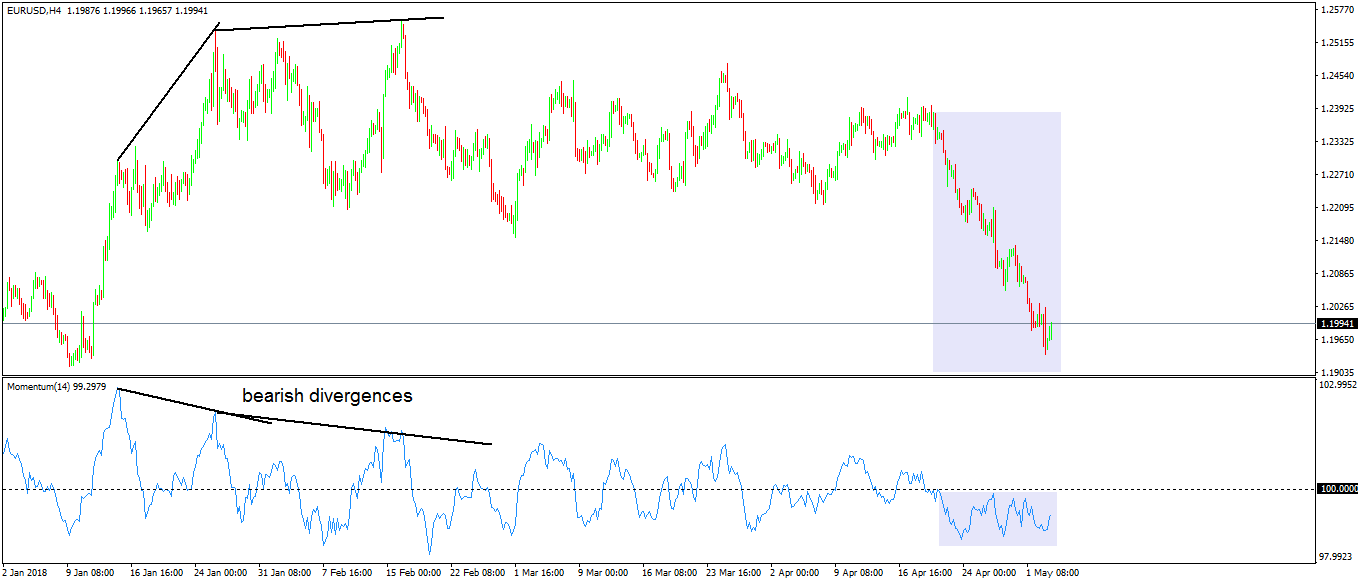
From left to right, let’s focus on the chart above. The price advances right at the start of 2018, with an almost vertical move. Then stalls and it builds a continuation pattern, most likely a pennant (a pennant is a triangular formation that takes less time to consolidate than an ascending triangle or a bullish flag, for example).
During the consolidation or the range, the Momentum comes back to its equilibrium point (the 100 level), but it doesn’t stay below 100 for long. The market breaks higher with a strong move, hitting values above 1.25.
However, while the price advanced for over four-hundred pips, the Momentum failed to print higher values. It means the speed of the price movement, or the strength of the trend, faded. A bearish divergence just formed, and bulls were warned.
Even the next spike higher, when the EURUSD reached the highest point on the chart, it was not enough to push the Momentum above the first high. In fact, the Momentum shows a decreasing strength of the bullish trend all the way until the recent break lower.
Conclusion
Technical analysis in Forex trading is full of indicators and oscillators that claim of having the key to the right price movement. None really do though.
What we can say without a shadow of a doubt is that the Momentum is one of the most complete technical analysis tools used to spot what the price will do next.
Divergences with the price are only one thing. Plenty of oscillators show divergences, and probably the one above appeared on other oscillators too.
However, the Momentum indicator is two in one. While offered as an oscillator, it is more a trend indicator than an oscillator.
As a tip, use the Momentum to filter the trading sessions. Rarely you’ll see the Momentum in full bearish or bullish conditions in the Asian session if you use lower timeframes to analyze the market.
In other words, it tells you when the market “dries out,” and the trending conditions soften. Hence, it tells day traders when to get out as the market is unlikely to trend anymore until London session starts again.
The best part of the Momentum indicator is that it keeps an objective eye on the market. Because it helps traders to spot ranges from trending markets, it opens the possibility of using a full set of other technical indicators to trade.
It certainly helps to filter fake moves the price makes and shows trending conditions when traders should avoid trying to pick a top or a bottom.
All in all, while having a simple calculation method, the Momentum indicator is one of the most complex indicators, and this is the reason why it is presented in this part of our Trading Academy. If there is one technical indicator to master, this is the one.