

Pitchfork and Elliott Integration Revealed
Surrounded by mystery, the Pitchfork tool as we know it today is the result of many traders that contributed to its development. To this day, there is a controversy regarding the way to accurately draw it on a chart.
More precisely, the Pitchfork is a set of three parallel lines designed to contain the price in a bullish and bearish trend. Traders use it in Forex trading in multiple ways, with the two popular approaches being to trade the ability of the Median Line (ML – the line in the middle) to attract the price and to trade the break of a so-called Schiff line.
Nowadays, the Pitchfork is known as Andrews Pitchfork, coming from the one that put the decisive touch on this trading tool, Dr. Allen Hall Andrews. But the birth of Andrews Pitchfork is a bit more complicated and surrounded in a mystical air.
At the late 1800’s, a guy named Robert Babson became so obsessed with Newton’s gravity law that he started using it in everything he did on a daily basis: an equal and opposite reaction follows every action.
He took the concept to the stock market and the Babson Normal Line concept appeared. Simply put, when the price sat above it, the market was bullish, and when below, the market was bearish.
George Marechal, a friend of both Babson and Andrews, took a variation of Babson line and came up with the concept of the Median Line as we know it today. The legend goes that President Roosevelt asked Babson to forecast the stock market in the 1930’s and 1940’s, and Babson turned to Marechal for the job. The resulting chart for the next fifteen years turned out to be almost a mirror of what the Dow Jones eventually did.
Finally, Dr. Andrews put the last touch on the Pitchfork concept by adding the two parallel lines known today as UML (Upper Median Line) and LML (Lower Median Line).
For those in doubt, it may be worth noting that Babson amassed a fortune in excess of fifty million dollars using his Normal Line concept (the predecessor of the Median Line). Let us also note that the Andrews Pitchfork was brought to another level by Jerome Schiff, who created his variation by changing both the price and the time for the first pivot.
Andrews Pitchfork Pivots
It is the pivots that play a crucial role in the developing of Andrews Pitchfork. Now in the 21st century, with computers and trading platforms available, charting should be easier.
In fact, it is a thousand times more difficult. We talk about a different market (Forex trading), with different players (international entities that buy and sell in large volumes) and with different volume and execution speed.
Yet, the challenges of placing the three pivots that make the Pitchfork persist. One way is to use the reversal sequence of a trend.
That means that traders must understand what makes a trend first:
- higher highs and higher lows make a bullish trend
- a bearish trend is made of lower lows and lower highs
With that in mind, the focus shifts to the break of these series. Therefore, when the price reverses a bullish trend, it breaks the series on higher lows. Consequently, it fails to make a new higher high.
Or, when the price reverses a bearish trend, it breaks the series of lower highs, without making a new lower low.
For Andrews Pitchfork traders, the absolute low or high represents the first pivot, followed by the first swing lower and higher/higher and lower for the second and third pivot.
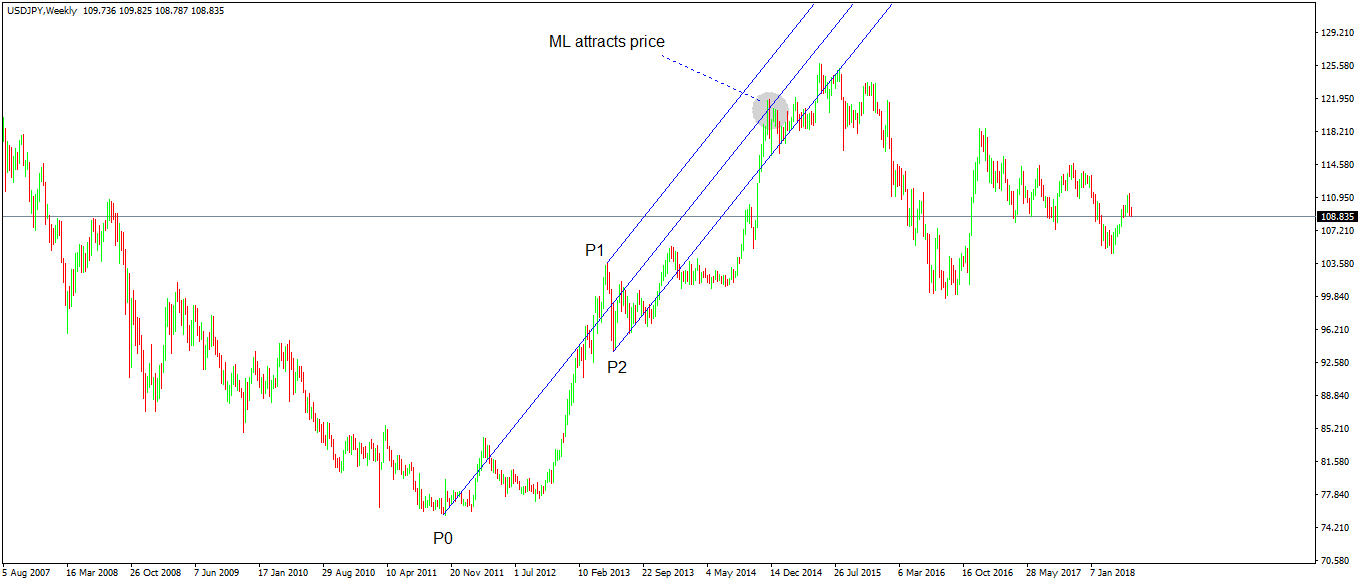
This is the USDJPY weekly timeframe. It shows the staggering rise of this major pair following the Bank of Japan’s (BOJ) announcement that it will begin quantitative easing (buying JGB – Japanese Government Bonds). The move that followed is one of the most influential Forex trading trends in the last decade.
Using the rules listed earlier, the absolute bottom is the first pivot or the P0. The swing higher that manages to break the previous lower highs series gives the P1 and the first pullback before a new higher high gives the final pivot, P2.
And then the Andrews Pitchfork’s interpretation of the price being attracted by the ML (Median Line) works like a charm. Imagine that this is the monthly timeframe. From the moment we can draw the Pitchfork, the market has a lot of room to advance until meeting the ML.
Elliott Integration with Andrew’s Pitchfork
This Trading Academy dedicated multiple articles on various parts of the Elliott Waves Theory. A funny coincidence is that by the time Elliott was working on his Wave Principle, Babson had made his fortune forecasting the stock market using the Normal Line concept that ultimately led to the birth of Andrew’s Pitchfork.
Still, a coincidence (or not!), is the action and reaction principle Elliott used to connect the impulsive and corrective waves. His idea of a market cycle that has two phases (one impulsive and one corrective) bodes well with the action and reaction concept.
As such, the two theories (Pitchfork and Elliott) complement each other so that the way to set the Pitchfork pivots help identify the reactive cycles within the Elliott Waves Theory.
Therefore, traders that know the two concepts use the Pitchfork’s way to identify the pivots to label the market reaction after an impulsive wave. More precisely, the second and the third pivot represent waves a and b in a correction. Moreover, the ML is used to find the possible end of the c-wave to end the cycle.

Sometimes, though, an impulsive wave follows another impulsive wave, either of a lower or similar degree. In that case, the second and the third pivots mark the end of the 1st and the 2nd waves with the Elliott Theory. Naturally, the ML serves for finding the end of the 3rd wave.

Following the same rules, traders interpret every market cycle to find great trades. For instance, the move higher that resulted after BOJ’s monetary policy change was followed by a correction too.
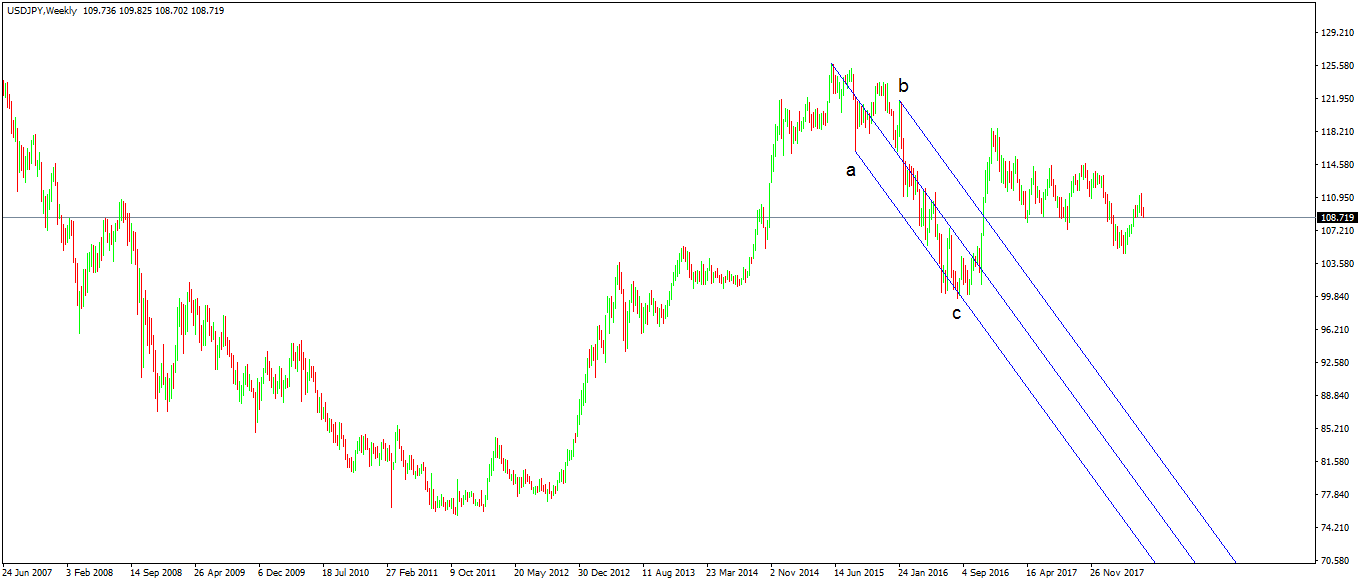
Using the same principles, we can easily spot the correct Elliott labeling in Forex trading to determine the target for the c-wave. In this case, the a-b-c represents the reaction to the previous bullish trend.
Conclusion
Technical analysis is comprised of a set of tools, trading theories, and even indicators developed a long time ago. Moreover, they were developed in a different market (mostly stock market or commodity) and not specifically for Forex trading.
After all, a chart shows the “traces” the price leaves. When the price moves faster due to faster execution as is the case in Forex trading, the traces differ than in the case of slower markets.
Nevertheless, the concepts used almost a hundred years ago are still good enough for trading setups that lead to disciplined trading. By using the Elliott and Pitchfork integration on multiple timeframes, one succeeds in labeling various cycles and finding different trades depending on the cycle.
While the Elliott Waves Theory may seem many times like a random walk through different times, the Pitchfork integration comes to shed a bit of light and brings discipline when trading with it.