

How to Use the Kinjun/Tenkan Cross Properly
Already presented in this trading academy as one of the most exciting ways to technical analysis, the Ichimoku Kinko Hyo has multiple uses in Forex trading.
On the one hand, it is a great trend indicator. The cloud or the Kumo leaves no shadow of doubt about the market direction.
On the other hand, all the elements that form it are in a perfect state of equilibrium. The equilibrium refers to the current prices when compared with previous and future support and resistance levels.
For this reason, it is one of the few indicators that provide both dynamic and classic support and resistance levels. Moreover, it is one that considers the time of a potential trade, in the sense that traders know in advance when the price might hesitate at a specific area. Only W.D. Gann used both price and time to forecast a trade, so we can say that the Ichimoku is one of the few indicators to provide this feature.
Here’s a quick review of the Ichimoku Kinko Hyo indicator and what makes it unique:
- Senkou A and Senkou B. These two lines give the shape of the Kumo, or the cloud. They are projected twenty-six periods ahead of the current price, and when Senkou A crosses above Senkou B, the cloud turns bullish. A bearish cross forms when Senkou A moves below Senkou B.
- Tenkan and Kinjun. These two lines act as a faster and slower moving average, considering previous higher highs and lower lows the price makes.
- Chinkou. A line destined to show previous support and resistance based on the current price equilibrium. More about the Chinkou in a future article here on the trading academy.
How to Use the Kinjun/Tenkan Cross
In Forex trading, the cross between the Kinjun and Tenkan lines is similar to the golden and death crosses with Moving Averages. The idea, in any case, is identical.
The problem with the golden and death crosses is that they appear quite late in the market cycle when the new trend is already well underway.
The Ichimoku shortens that time significantly, drawing a warning that the trending conditions changed, and it is no longer wise to remain in a trade. It doesn’t tell that the trend will reverse. Instead, the Kinjun/Tenkan cross tells that trending conditions paused, and at least a period of consolidation will come.
Despite conventional wisdom, consolidation does have its costs. If the trade is part of a swing trading strategy (which most likely is the case when trend trading), associated costs are most likely negative (negative swap charged on the trading account for every rollover at the end of the trading day).
Here is what trending conditions with the Ichimoku look like:
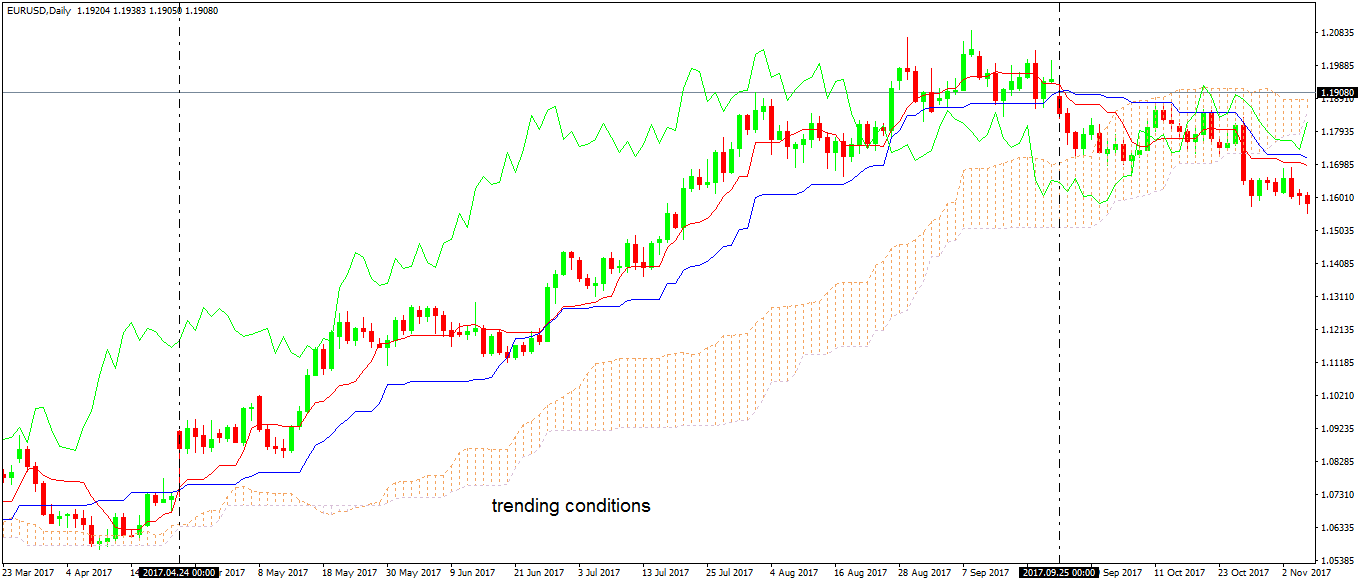
The two vertical lines define the trending conditions. As you can see, the starting and ending point of the area are given by the red line crossing above and below the blue one. Or, by the Kinjun/Tenkan cross. Now do you understand why it is essential to focus on this cross? It is the first signal that something is about to happen, and have the advantage of being visible, making it impossible for traders to miss the change in a potential trend.
In other words, for perfect trending conditions with the Ichimoku indicator, we need:
- In a bullish trend
- The Chinkou (green line) above the price
- The Tenkan (red line) above the Kinjun (blue line)
- Senkou A above the Senkou B (bullish cloud)
- In a bearish trend
- The Chinkou (green line) below the price
- The Tenkan (red line) below the Kinjun (blue line)
- Senkou A below the Senkou B (bearish cloud)
As you probably are familiar with already, trends don’t form that often in Forex trading. More precisely, the market spends most of the time in consolidation (over sixty-five percent of the time is spent in ranges).
It makes it difficult to find perfect trades and perfect trending conditions. Hence, the focus shifts from identifying trending conditions to spotting the start and end of a range.
With the Ichimoku indicator, that means the focus shifts on the Kinjun/Tenkan cross.
Kinjun/Tenkan Cross in Forex Trading
Used as a single element in a trading decision, the Kinjun/Tenkan cross isn’t that effective. In Forex trading, every currency pair has a different characteristic, with some trending more than others.
For example, the major pairs (a.k.a. the pairs that have the U.S. Dollar in their componence) tend to trend more than crosses (a.k.a. pairs that don’t have the American Dollar in their componence), by a factor of 1.2 or even more.
Hence, a trade like the one below is more likely to appear on a major pair rather than on a cross. This is the recent EURUSD drop from around 1.24 to the current 1.19 level.
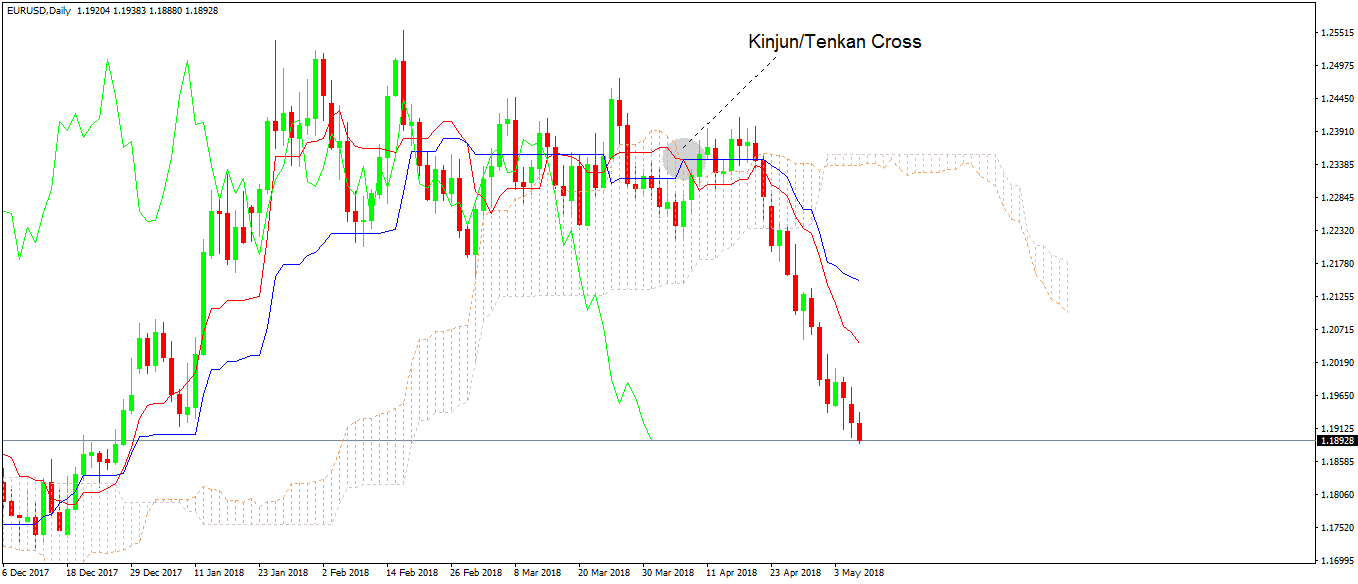
As you can see on the chart above, the Kinjun/Tenkan line formed well ahead of the actual drop. More precisely, it formed about ten days earlier, well ahead of the strong bearish trend that appeared evident on the screen. That would be about two trading weeks knowing in advance the Kinjun/Tenkan cross showed bearish conditions. Hence, trading on the long side wouldn’t be recommended.
But this is just a perfect example. Fake signals appear as often too.
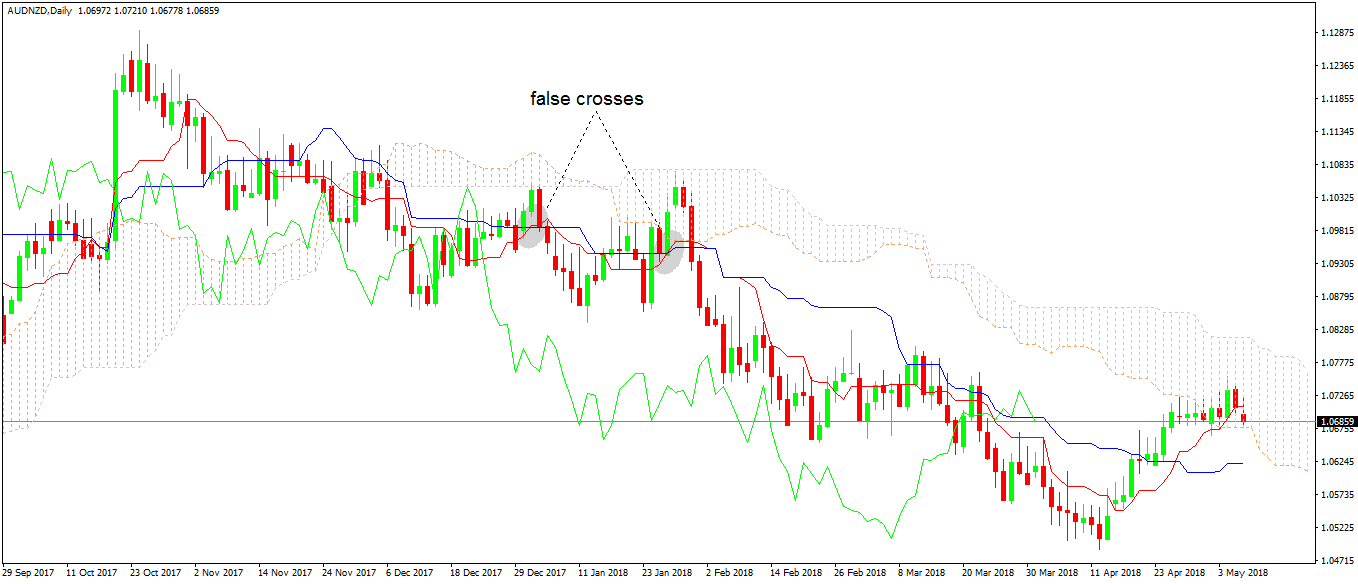
The AUDNZD cross pair from above shows a significant drop from around 1.13 to below 1.05. However, during the fall, the pair didn’t form perfect trending conditions. It even gave two false signals or false Kinjun/Tenkan crosses.
Is there a way to filter them? The answer is yes.
The key to correct interpretation comes from the time element. Remember that at the start of the article it was mentioned that the Ichimoku is one of the few indicators to consider the time component?
The thing is that the indicator projects the Senkou A and Senkou B (or the cloud) forward in time. More precisely, twenty-six periods ahead of the current price.
In other words, check the chart above and pick any one single candle you wish. Next, count twenty-six candles on the right side of it. Finally, the cloud was there when that candle formed. Hence, it acts as support or resistance for future price levels, following the price in a dynamic way.
Therefore, what seemed like a bullish Kinjun/Tenkan cross, turned out to be one forming with the price of significant resistance. That is not a bullish sign, and all one has to do is to wait and see if the resistance holds or not.
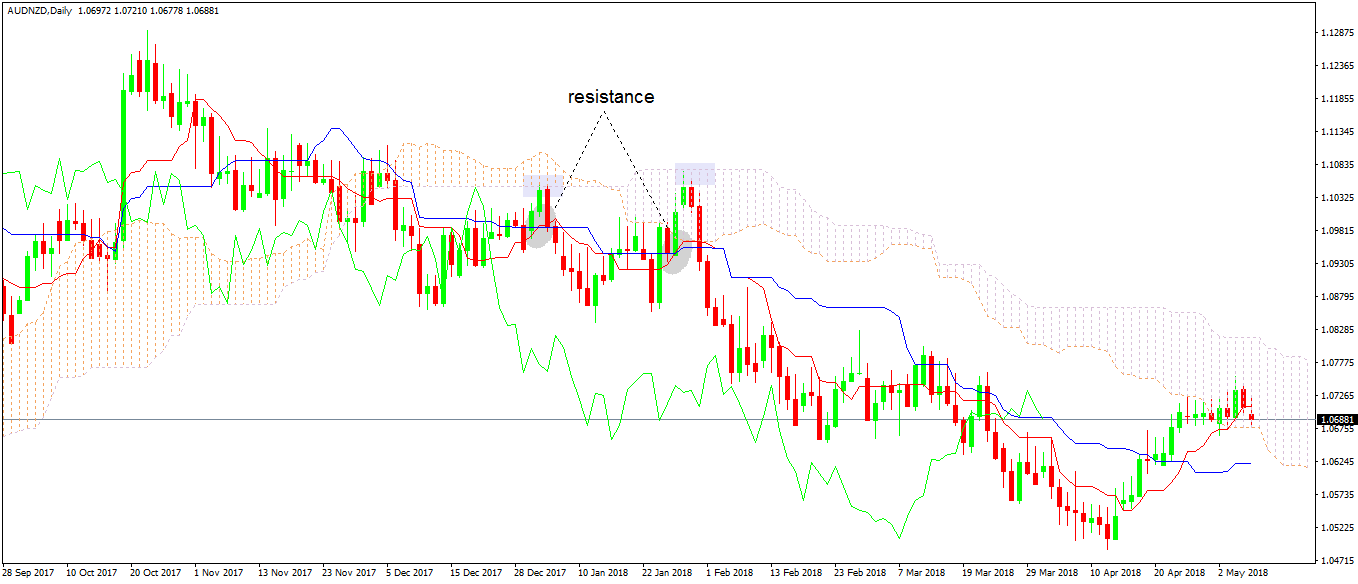
If it does, as we see on the chart above, the next Kinjun/Tenkan cross in the direction of the prevailing trend gives the entry on the short side.
As for the setup, use the top of the cloud to set the proper stop loss and stay on the trade until the next Kinjun/Tenkan cross forms. Or, use a correct risk-reward ratio of at least 1:2, ideally 1:3.
Conclusion
In Forex trading false signals appear often. Even the perfect bullish trend suffers tremendous dips, or the most reliable bearish trends see spikes that can kill a trading account.
Hence, traders should spend a lot of time filtering the signals on their strategy and focusing on the probabilities that the trade may survive.
Traders that make it in this industry need to consider the risk before thinking of the reward. A proper risk-reward ratio is the cornerstone of any trading strategy. Stay tuned for the next articles to reveal more about effective money management strategies to use.