

Pattern Recognition in Forex Trading: Bullish and Bearish Flags
Still on the classic technical analysis patterns, flags are consolidation areas that form during a trend. Hence, they show continuation and the trend resumes after the flag breaks higher.
In Forex trading flags form often. However, they look a bit different than in theory, because the currency market has higher volatility.
Above all, flags deceive traders. Because there is no time limitation for a flag pattern, the market may stay in a flag formation for a long time.
Moreover, it isn’t mandatory for flags to only form on the horizontal, as many believe. A flag may correct a trend, but always keep in mind that the correction is temporary: the trend won’t reverse.
The timeframe plays a crucial role in interpreting a flag. If traders know that the flag will, eventually, break in the direction of the underlying trend, they use the consolidation area to add to a position.
Forex trading with the flag pattern may be aggressive (trading during the flag formation) or conservative (placing a pending buy stop order in a bullish flag or sell stop order in a bearish one). When the flag forms on bigger timeframes, the entry is relevant because the trader may block the margin for quite some time and pay negative swaps if the position remains open overnight.
Like all patterns that belong to the Western technical analysis approach, flags come with a measured move. Here’s what makes a bullish or a bearish flag:
- A bullish or a bearish trend.
- One consolidation area, that may or may not form on the horizontal
- A measured move that once reached, confirms the flag formation
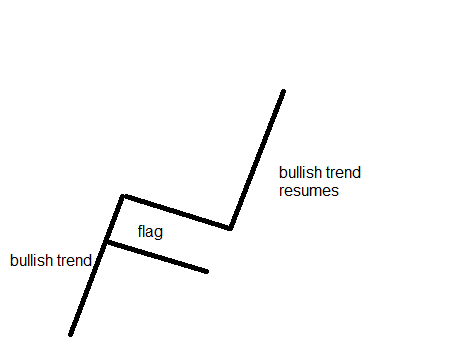
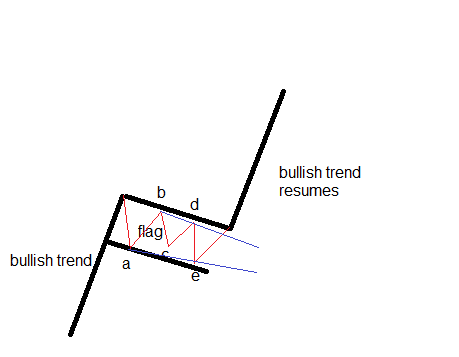
Here’s how a bullish flag looks in theory:
And, here how one looks on the Forex market:
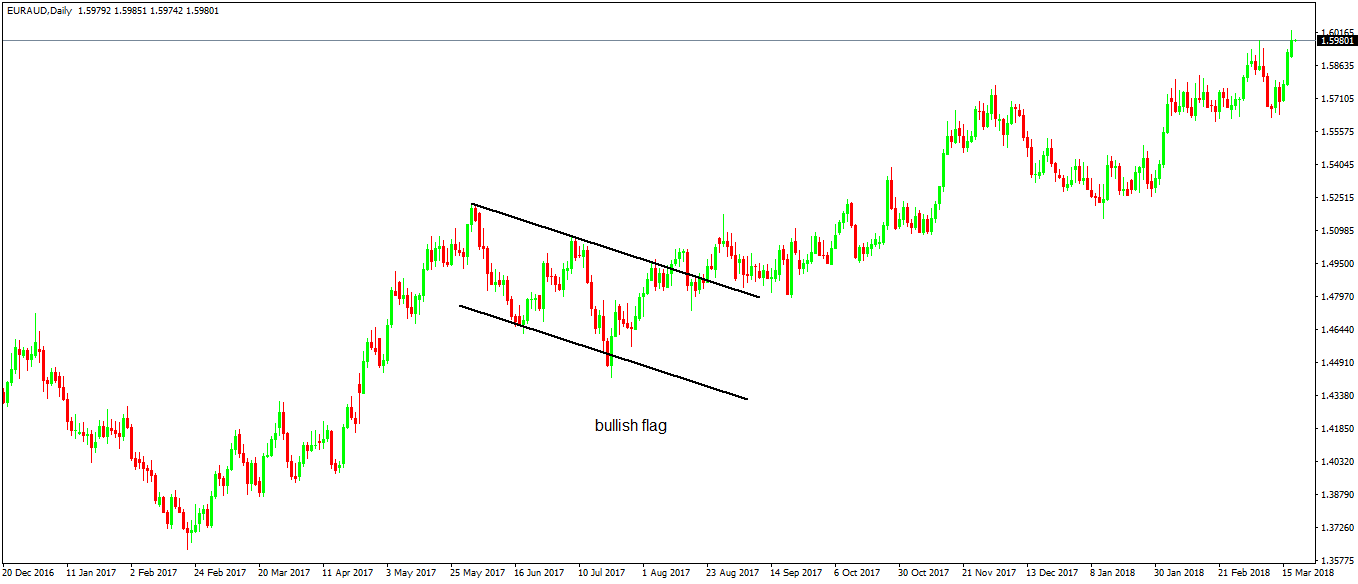
The difference between the two images is striking. However, the trick to spot a flag formation is to look for two parallel lines.
In the end, they make the difference between a triangle and a flag. If the two lines converged towards a common point, the market would form a contracting triangle.
A triangle following a bullish move like the one above is called a pennant. Its interpretation is somehow similar to the one of a flag.
Flags in Forex Trading
Because flags are continuation patterns, the first thing to check is the presence of a trend. A bearish trend leads to bearish flags, while bullish flags form in a rising market.
Next, traders wait for a consolidation. Typically, the consolidation areas in Forex trading happen before critical economic data comes out. Therefore, the market consolidates until the previous trend resumes.
After the flag breaks higher or lower, the measured move gives traders a target. Most of the time, the risk-reward ratio is good enough to simply target the measured move of a flag.
As mentioned earlier, there are two ways to trade a flag pattern: an aggressive and a conservative approach.
The aggressive approach calls for entering a trade in the lower part of a bullish flag when the market makes a new low. Of course, the opposite applies to a bearish flag.
To spot it better, traders divide the flag into two equal parts, to delimitate the area.
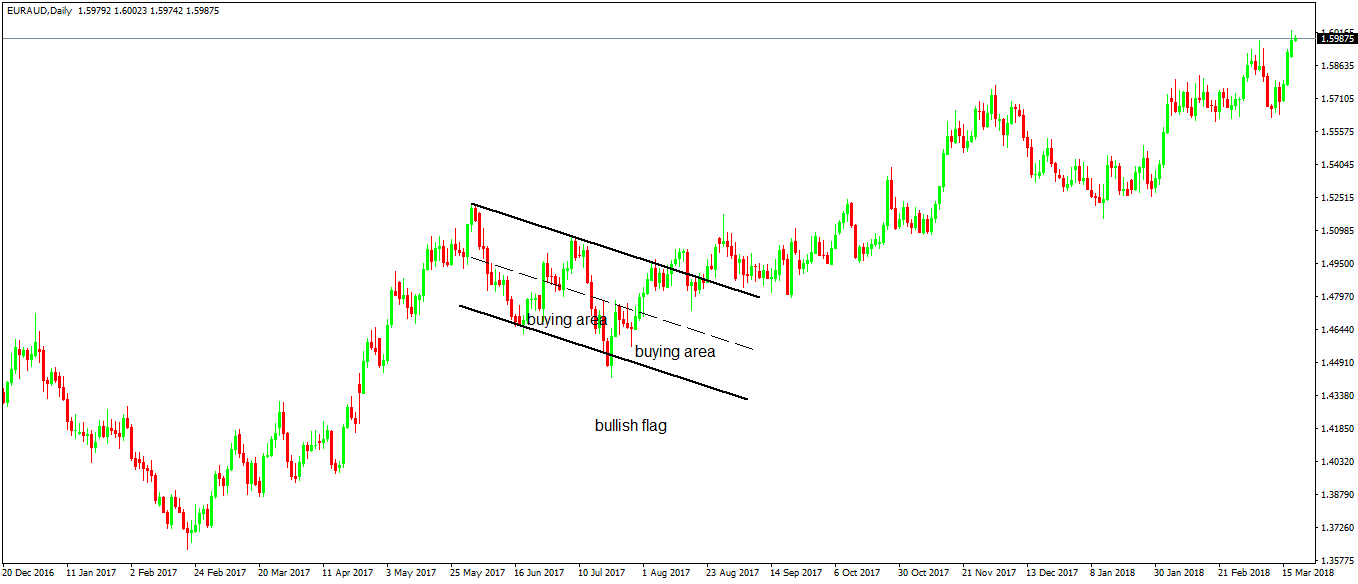
The risk is that the market keeps making new lows while holding the channel characteristic for a bullish flag pattern. But again, this is an aggressive approach, and aggressive strategies bear more risk.
Conservative traders will not only wait for the flag to break, but they check the series of lower highs to break too. That’s where they go long.
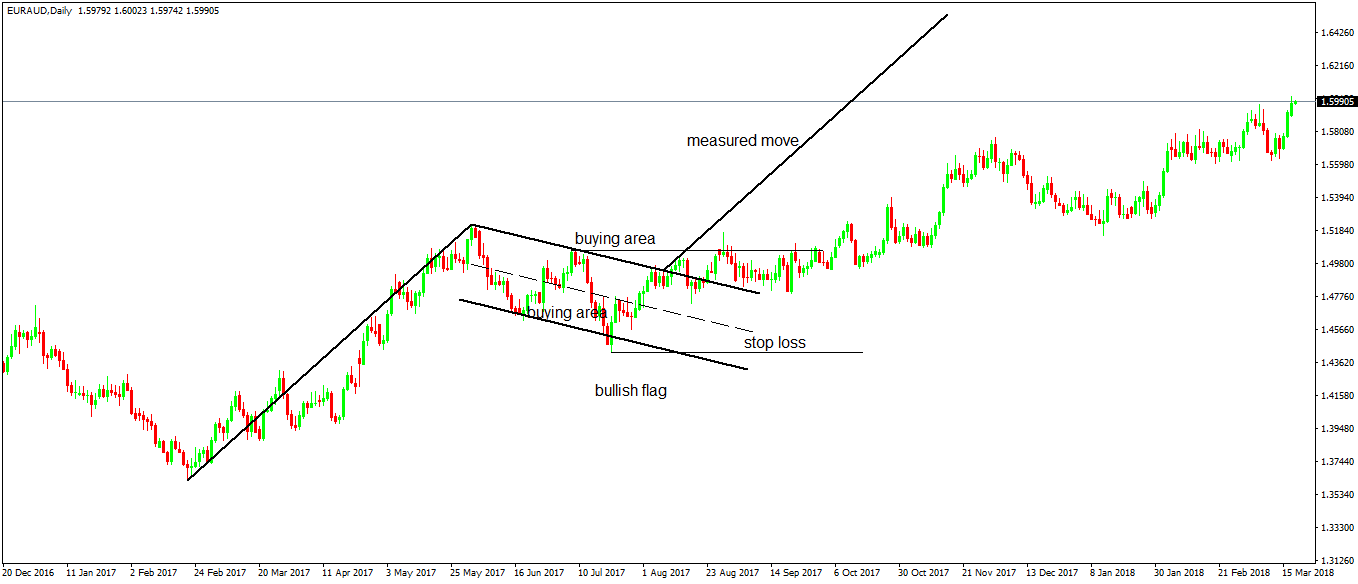
Next, they set the stop loss at the previous lower swing and target the measured move.
Speaking of the measured move, to calculate it, just use a trendline and measure the length of the move before the flag’s formation. After that, copy and project it from the moment the flag broke. That’s the target or the take profit.
In the example used, the EURAUD formed the bullish flag pattern on the daily chart. It took more than two months for it to develop, but it could’ve taken longer.
The conservative approach implies traders will go long only when the flag breaks and the price invalidates the lower highs series. Even so, the risk-reward ratio is generous enough.
While the measured move didn’t yet come, the bullish trend resumed, and the target is within grasp.
Typically, by the time the market travels half the measured move, traders raise the stop loss to break-even. This way, they protect the trading account and then only let the profits run.
Flags and Oscillators
Flags are great patterns to trade with oscillators. However, not on the same timeframe, but on a lower one.
We already previously discussed the way to use an oscillator in Forex trading. It shows overbought and oversold levels and works best when the market forms a range or a consolidation.
Well, that’s precisely what flags do! They form a consolidation.
Hence, using an oscillator allows riding small trends on shorter timeframes, while keeping an eye on the rules of trading the flag.
In the case of the EURAUD daily chart, the idea is to open an hourly chart and check the overbought and oversold levels. Because we deal with a bullish flag, try buying oversold, and avoid selling overbought.
However, close the trade when the oscillator reaches the overbought area, as the flag may continue. The RSI (Relative Strength Index) is a great oscillator to use with ranges, so it works nicely with a bullish or a bearish flag, during its consolidation.
Flags in the Elliott Waves Theory
The Elliott Waves Theory looks at the entire historical prices of a financial security. Therefore, in the case of a currency pair, the more data, the better.
Some currencies exist for a long time, like the U.S. Dollar and the Canadian Dollar, so traders can track their historical prices and build nice yearly charts. From those charts, using a top/down analysis concept, they count the waves and different cycles to reach the current pattern.
Elliott found that consolidations form most of the time, with the favorite pattern being a triangle. However, can we say that a flag fits the Elliott triangular formation?
Well, it fits some of them, indeed. Elliott defined so many types of triangles that the special ones that travel within the a-e and c-e baseline look like flags.
Conclusion
Bullish and bearish flags represent consolidation patterns. The market just builds energy before the previous trend resumes.
Because they form so often on any chart, traders noted them and started to document the pattern. They all have a measured move derived from the distance the market forms before the flag (or the pole of the flag).
When the price reaches the measured move, the pattern is confirmed. Different types of trading styles lead to different ways to use the flag patterns.
Some traders wait religiously until the price reaches the measured move. Some others book half the profits at half the distance and raise the stop loss to break-even, just to make sure the market won’t reverse.
Aggressive traders actively trade during the flag formation, knowing that that’s a risky approach in Forex trading.
In any case, bullish and bearish flags are here to stay. Even if the market changes, with new technological improvements and all, consolidation areas will be part of the technical analysis for the years ahead.
Hence, embracing bullish and bearish flags as part of a trader’s toolbox will lead to a better understanding of the price action in Forex trading.