

Understanding Japanese Candlesticks: The Bullish and Bearish Engulfing
The Japanese approach in technical analysis introduced to the Western world, a new way to interpret the markets. A candlestick chart now represents the favorite or the first choice among retail traders involved in Forex trading.
Unlike a bar chart, candlesticks show the price action within the candle. Therefore, the way the real body and the two shadows (upper and lower shadow) look, tells a trader some things about that respective market.
Combined with classic technical analysis patterns, the Japanese candlestick techniques offer reinforcement to the overall analysis and a faster entry, as they take less time to form.
So far, we treated two reversal patterns in this Trading Academy: the hammer and the morning and evening stars. Both concepts look alike from a Forex trading point of view (the actual trading setup), but the difference comes from the number of candles that form the two patterns.
Besides the hammer and the stars, a bullish and bearish engulfing is an important Japanese candlestick reversal pattern. This pattern differs from the hammer and the morning and evening stars as it takes two candles to form.
Conditions for the Bullish and Bearish Engulfing Pattern
Any reversal pattern forms at the end of a trend, and this one is no different. A two-candle pattern, the engulfing sees a quick reversal, with the trend suddenly changing direction.
The bigger the timeframe, the stronger the implications. Swing traders and investors look at the weekly and monthly charts towards the end of the week or month to see possible reversal patterns.
Because the engulfing pattern only takes two candles, it offers the fastest way to enter a market, way before other classic technical analysis patterns (head and shoulders, wedges, double and triple tops, etc.).
For any reversal pattern to form, a trend must exist first. That is the primary condition, and without it, any group of two candles may resemble the engulfing pattern, but it won’t matter. Traders should discount it.
During a bullish trend’s advancement, green candles predominate the chart. As such, traders won’t know when the bearish engulfing pattern starts, since the first candle in the pattern is bullish too.
It has a large real body and typically closes at the highs, thus having little or no upper shadow. One candle is already half of the pattern, so the exciting part comes from the moment the second candle opens.
The engulfing concept requires the second candle to be bigger than the first one. Hence, it engulfs it completely.
In Forex trading, that’s a tricky statement. Nowadays, the typical trading account offers five-digit quotes for currency trading, making it almost impossible for the market to gap at the close of a candle.
However, the idea of an engulfing pattern holds true, and traders must be a bit flexible with it on the currency market. As such, look for similar levels for the closing and opening price of the two candles to be enough for the bullish and bearish engulfing to make sense in Forex trading.

Above you see the representation of a bearish engulfing. While it seems simple, the market doesn’t form the pattern so often as many think.
Try for yourself and open any timeframe you want, on any currency pair, and you will see that the engulfing pattern doesn’t appear very often. More precisely, you’ll find that many times the market forms a pattern similar to the engulfing, but it should be ignored.
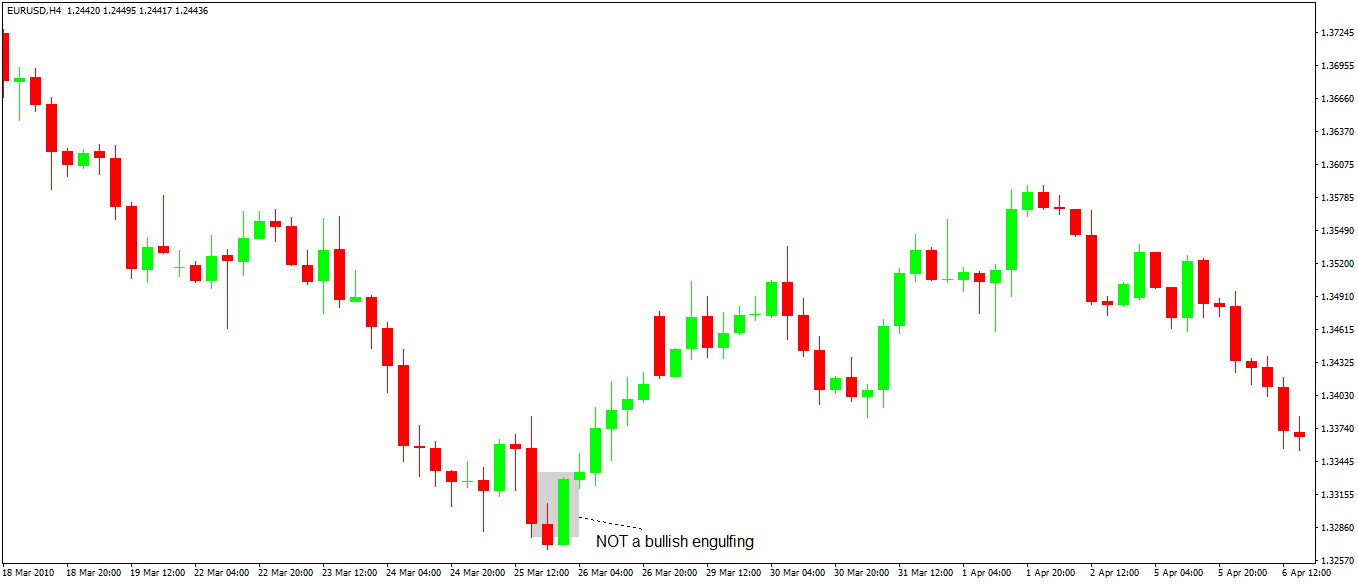
You see, there’s a catch to the engulfing pattern: the engulfing concept refers only to the real body, not to the shadow as well!
As such, the second candle’s real body must engulf only the first candle’s real body. That’s it!
When and if it does that with the shadow too, traders should disregard the pattern. Here’s a representation of a fake bullish engulfing below. If you see it, just ignore it.
For a bullish engulfing, the market must fall. The first candle in the pattern won’t signal anything, as it is just another red candle, showing bearish conditions still exist.
However, the second candle is a strong, green candle, showing bulls try to take control. If it engulfs the first candle’s body, without engulfing its upper shadow too, we have a bullish engulfing present.
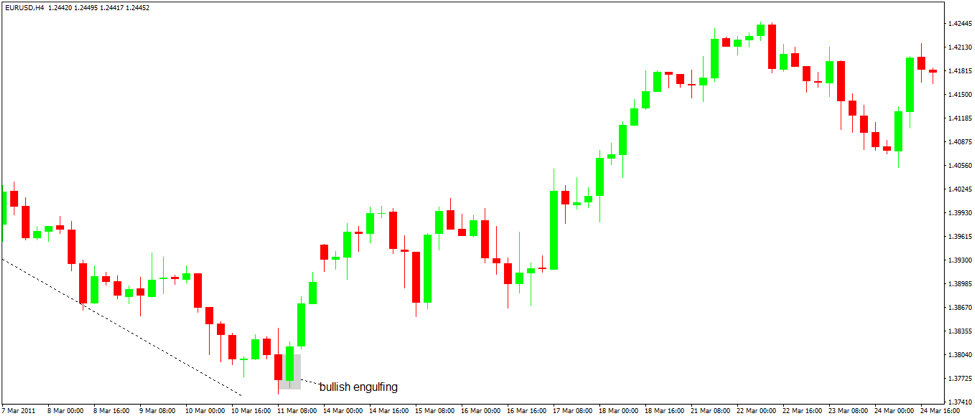
Now compare the last two charts and see the difference. It’ll help you filter fake patterns from the good ones.
Because the bullish and bearish engulfing patterns don’t form that often, they are quite powerful. Hence, a Forex trading plan doesn’t wait for the normal market pullback like in the case of the hammer or the morning and evening stars.
Trading Bullish and Bearish Engulfing Patterns
Trading the two patterns has clear rules for the entry, stop loss and take profit. We know by now that in Forex trading the take profit level respects at least 1:2 risk-reward ratio.
It means that for every pip (the fourth digit in a currency pair’s quote) risked, the reward should be a minimum of two pips, with 1:3 being ideal. For example, if the Forex trading plan requires fifty pips stop loss, the take profit level is set at one hundred or one hundred and fifty pips above (in a bullish trade) or below (in a bearish trade) the entry level.
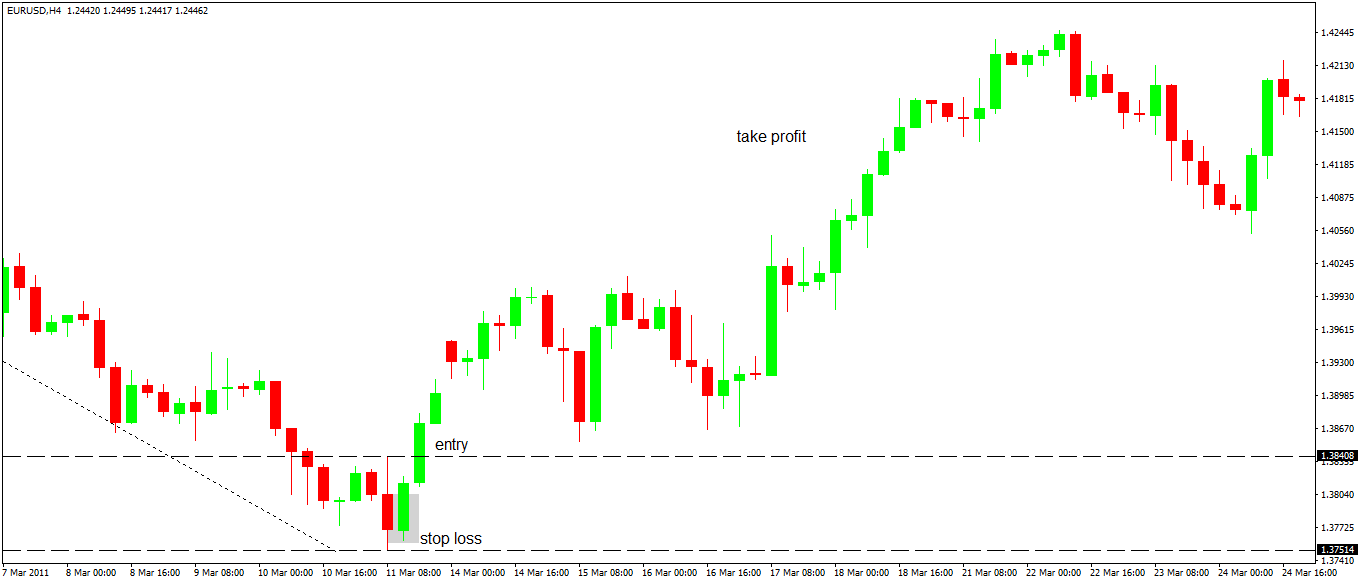
Here’s how to trade the bullish engulfing pattern:
- Enter long at the close of the second candle
- Place a stop loss at the lowest point of the pattern (regardless if it’s on the first or the second candle)
- Measure the distance between the highest and the lowest point of the bullish engulfing
- Project it two or three times higher from the entry point to find out the take profit level.
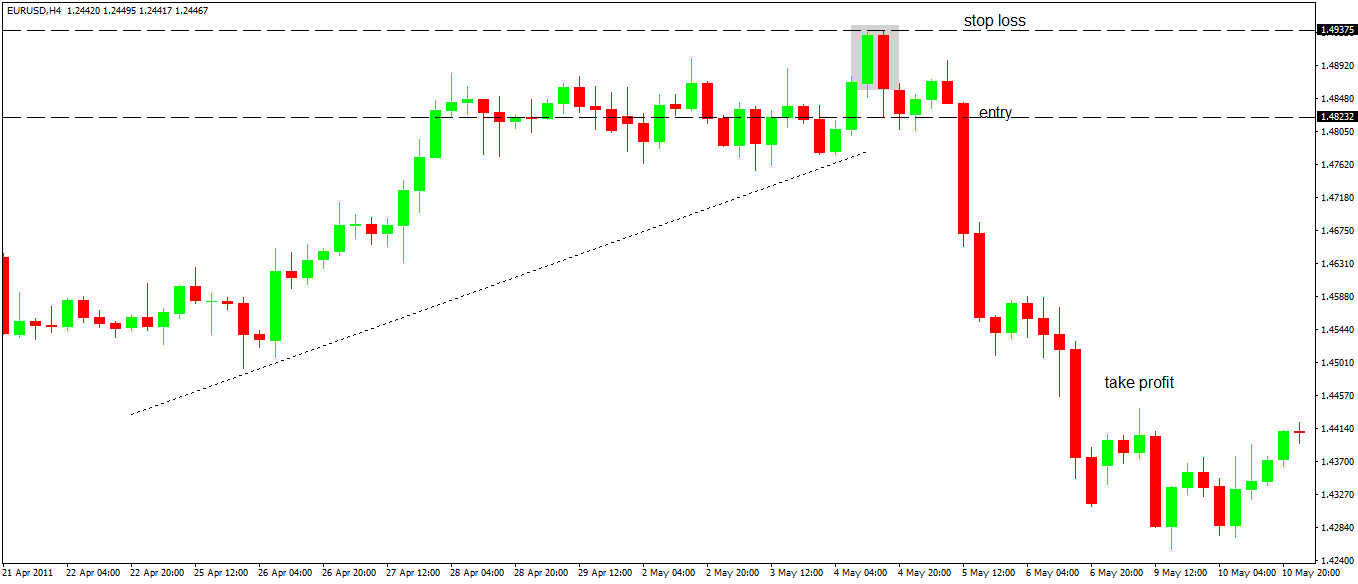
For the bearish engulfing pattern, the Forex trading plan looks like this:
- Enter short at the close of the second candle
- Place a stop loss at the highest point of the pattern (regardless if it’s on the first or the second candle)
- Measure the distance between the highest and the lowest point of the bearish engulfing
- Project it two or three times lower from the entry point to find out the take profit level.
The usual caveat applies: the more significant the time frame, the bigger the implications for the overall market. Imagine you analyze the entire dollar index via a Japanese candlesticks perspective.
As such, a bearish or bullish engulfing, or reversal pattern, tells you much about the price action to follow on individual currency pairs that have the USD in their componence.
Conclusion
One cannot compare the Japanese candlesticks patterns and say which one is more powerful. Instead, we can say that the price formations at the end of bullish and bearish trends are powerful enough to result in an excellent opportunity for a trade.
After all, this is what Forex trading is: finding good trades, or chances in a market that fluctuates. Of course, not all trades make a profit.
But that is alright if there is a stop loss in place. Because of the risk-reward concept part of any money management system, traders cope with a loss as being part of the Forex trading plan.
While the engulfing patterns don’t form that often, there are many timeframes and currency pairs in which you can look for them. The typical Forex dashboard lists a couple dozens or more markets, and each one of them has around nine timeframes.
As such, it may be that on one currency pair you have a change to trade the hammer pattern, on another one a bullish engulfing and yet another one an evening star. Or, it may be that you want to trade the same currency pair but in different directions, because the patterns formed on different timeframes (providing hedging is allowed).
In any case, bullish and bearish engulfing patterns are just another disciplined way to approach Forex trading, giving traders more chances to make a profit. For this reason, they are an essential trading tool in a trader’s technical analysis arsenal.