

Triangles as Consolidation Patterns
Triangular formations are the favorite way for a market to spend time. They appear exceptionally often in Forex trading, so a proper understanding of them its mandatory for anyone involved in buying or selling currencies.
Markets build energy before the next move up or down. In Forex trading, a currency pair moves for various reasons, technical and fundamental ones.
The saying goes that, while the technical analysis shows the direction, the fundamental one represents the reason why the market moves. Hence, before critical economic releases, the currency market spends time in consolidation. When this happens, the likelihood of a triangle to form is extremely high.
Triangles as Continuation Patterns
One of the classic technical analysis patterns, triangles as continuation patterns form during strong trends. Because even the strongest trend needs a pause. When a triangle breaks, the previous trend resumes.
We have already covered two of the most important triangles as continuation patterns: the ascending and descending triangles. Typically, the price meets support or resistance on a horizontal level, builds energy by forming a series of higher lows (in an ascending triangle) or lower highs (in a descending triangle) and eventually the breakout comes.
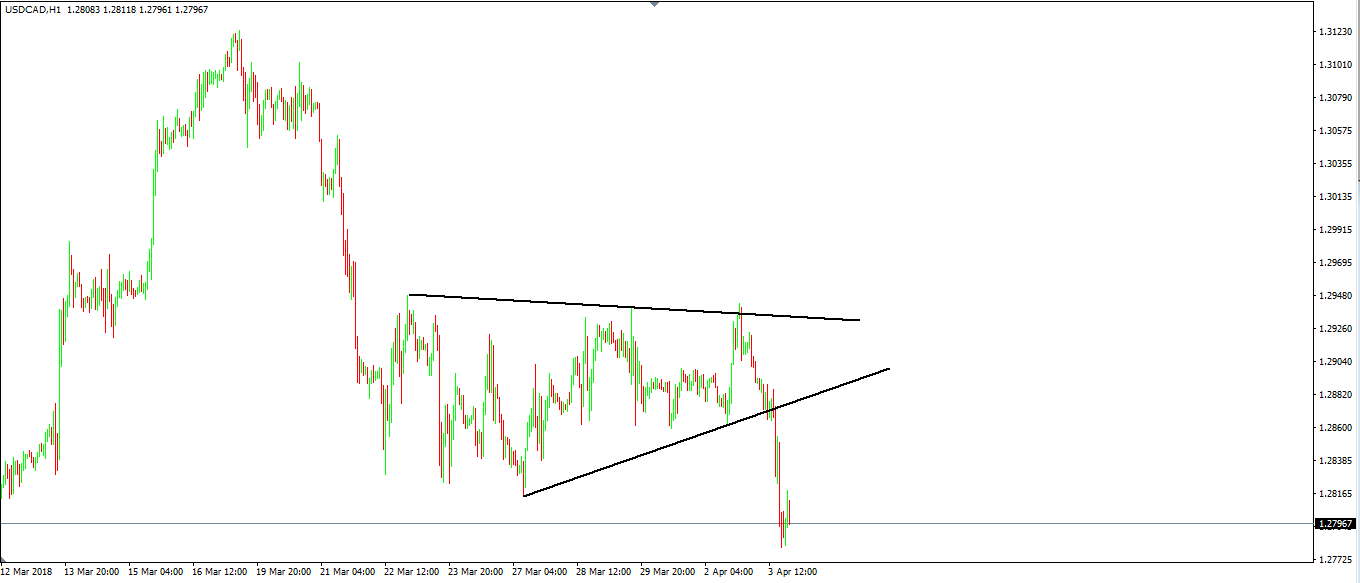
The recent USDCAD price action illustrates a triangle as a continuation pattern. While not a descending pattern, the triangle broke lower, making a new low when compared with the previous one.
The bearish move that started recently, took the most time to consolidate, rather than to trend. And, the favorite way for a consolidation is a triangle.
In this case, the market formed a symmetrical triangle, but more about the triangle types later in the Intermediate level part of this Trading Academy.
Pennants also appear in a trending market. A pennant looks like the USDCAD triangle from above, only that:
- They form in a bullish trend
- It takes the market less time to consolidate
- The breakout is more powerful
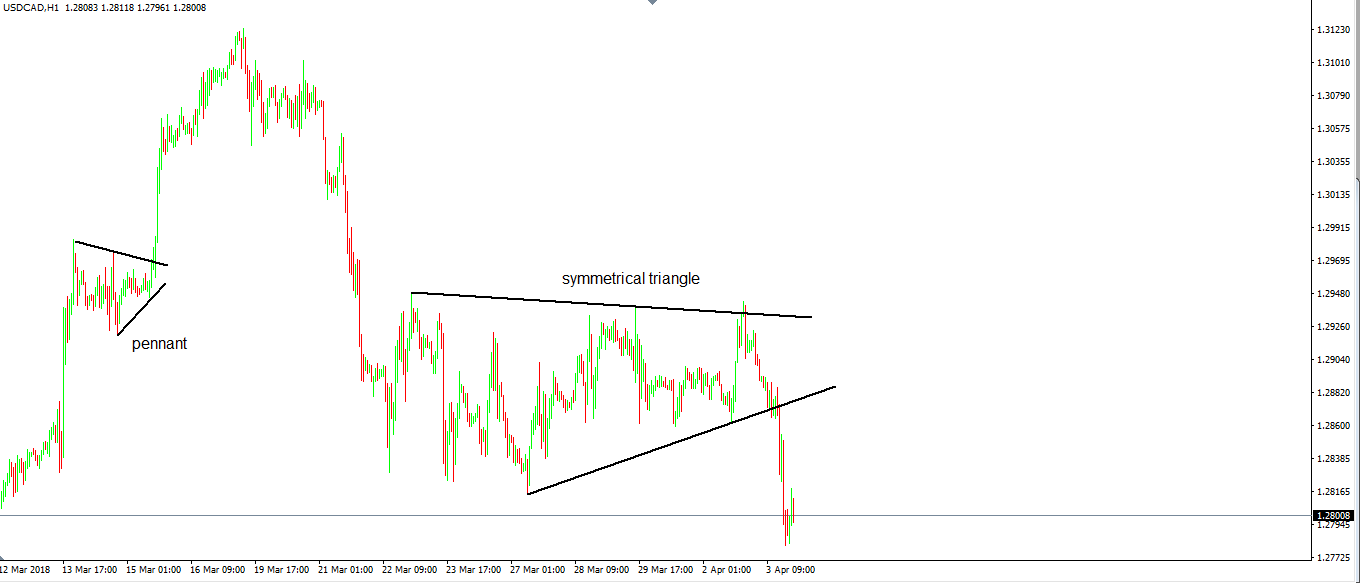
The same USDCAD timeframe shows a pennant formation right ahead of the symmetrical triangle. During the bullish trend, the market paused for a while.
This could be due to various reasons, like:
- Asian session comes, and typically there’s little or no movement until London opens
- The market pauses before an important economic release
A pennant has a measured move too. The thing to do is to measure the vertical move prior to the pennant formation and project it from the moment the price breaks higher.
When reached, the pennant’s “job” as a continuation pattern has ended. Naturally, the stop loss for the long trade is placed at the lowest point in the pennant formation.
Pennants form in stronger trends than the trends where other triangles as continuation patterns appear. However, they are just another form of market consolidation, with a different set of rules for trading.
Triangles with the Elliott Waves Theory
So far in our Trading Academy, we have covered the basics of the Elliott Waves Theory. Here are the main points again:
- Elliott split the moves the market makes into impulsive and corrective waves
- An impulsive and corrective wave form a cycle
- The market creates multiple cycles of various degrees
- Impulsive waves are labeled with numbers
- Corrective waves are labeled with letters
Elliott put a lot of emphasis on triangular formation. Many consider triangles as the cornerstone concept behind the theory.
And, for a good reason. The Elliott Waves Theory is the only one that treats triangles as reversal patterns, not only as a consolidation pattern.
Because of that, they fit the volatility in the Forex trading world perfectly. Elliott placed a lot of importance on consolidation area or corrections.
In Forex trading, more than in other financial markets, the price spends most of the time in corrective waves, not in impulsive ones.
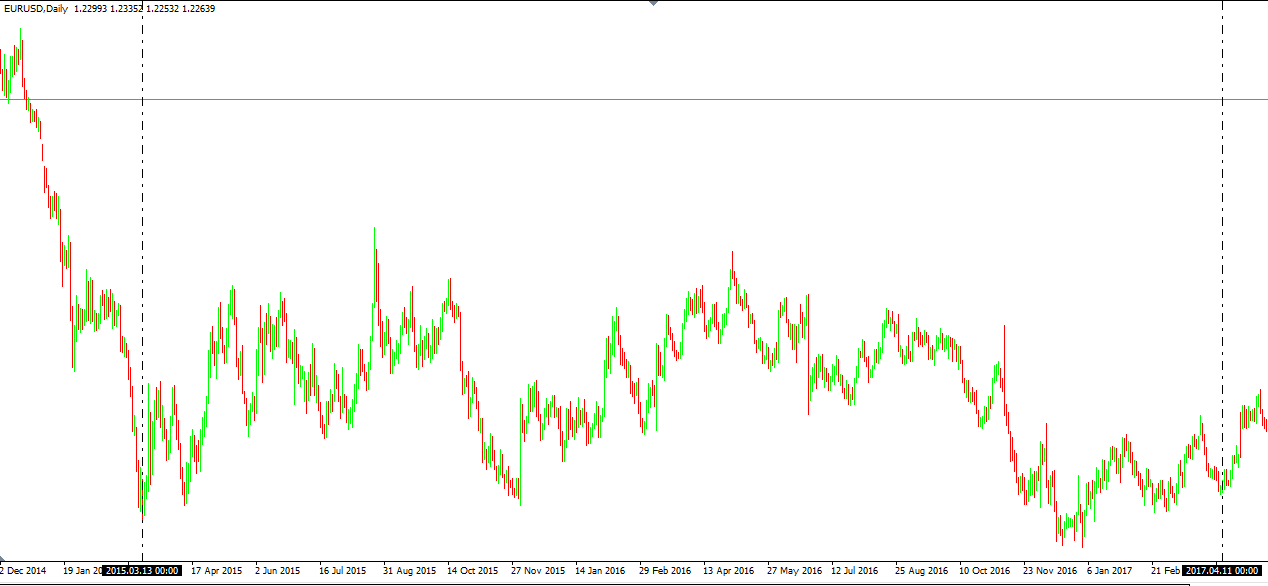
Here’s the EURUSD daily chart. For three years, the pair just consolidated around some tight levels. Because of the timeframe, the range was significant, but it was still a range.
When the price forms a series of lower highs and higher lows, the first thing that comes to mind is a triangle. But, Elliott pointed out that a triangle as a continuation pattern within the Elliott Waves Theory only appears in two places:
- The 4th wave of an impulsive move
- The b-wave of a zigzag
Remember what we said at the beginning of this article? When the market consolidates, it does that ahead of important events, either economic or political ones.
In this case, two key events played a major role in Forex trading during this time:
- The Brexit referendum in the United Kingdom
- The U.S. Presidential election
In other words, until the two events passed, no one wanted to take a chance on the EURUSD pair. Of course, we talk about investors and swing traders, not scalpers that deal with lower time frames.
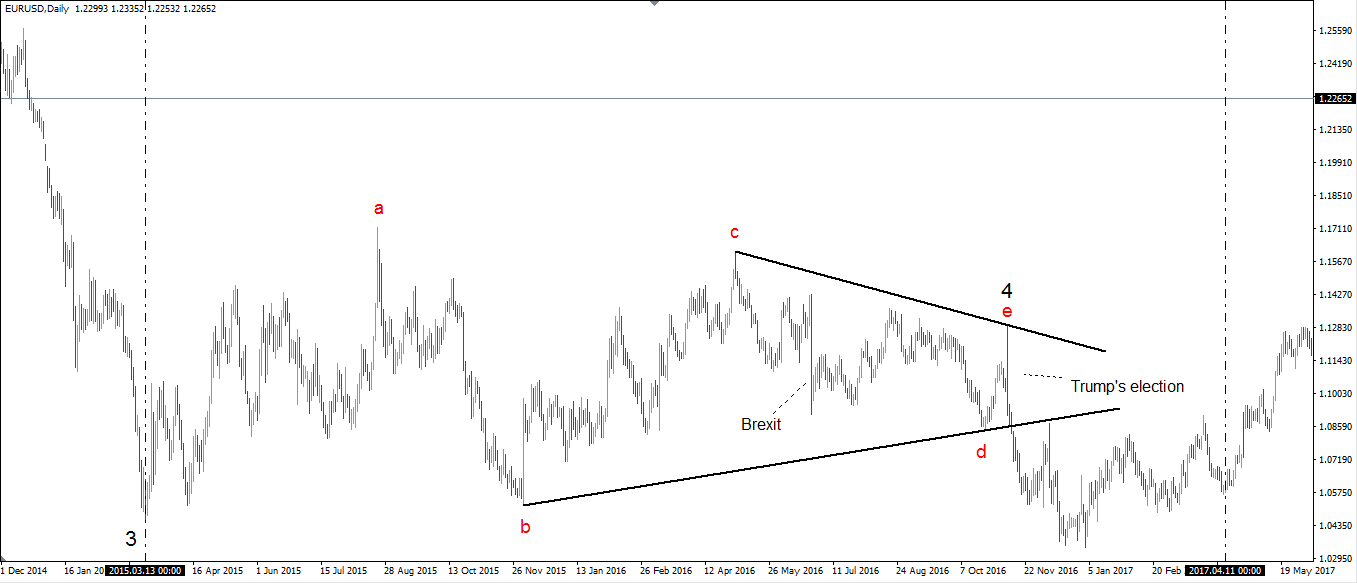
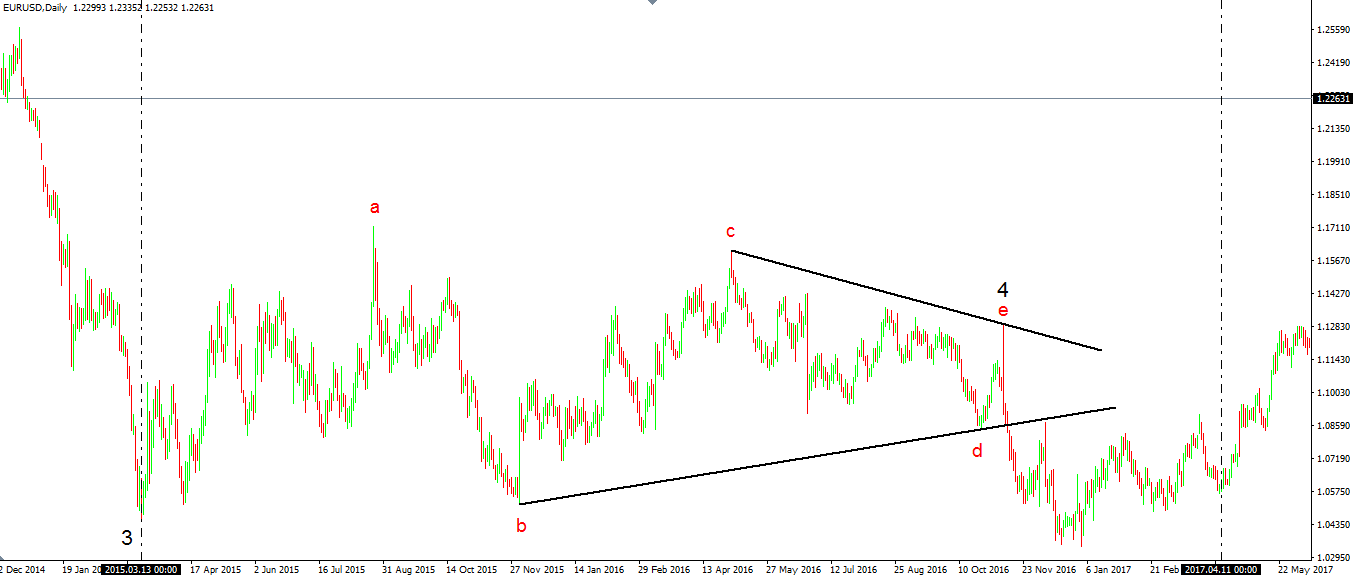
Here’s how the two events influenced the triangular formation. In the bigger perspective, they were part of the pattern, nothing special.
However, the Trump election in the United States proved to be a decisive point for the triangle, as it broke lower. But, a close look at the previous trend (the move prior to the triangle), reveals it was bearish.
Therefore, the triangle acted as a continuation pattern. As such, using the Elliott Waves Theory, it can only be the fourth wave of an impulsive wave or a c-wave in a zigzag.
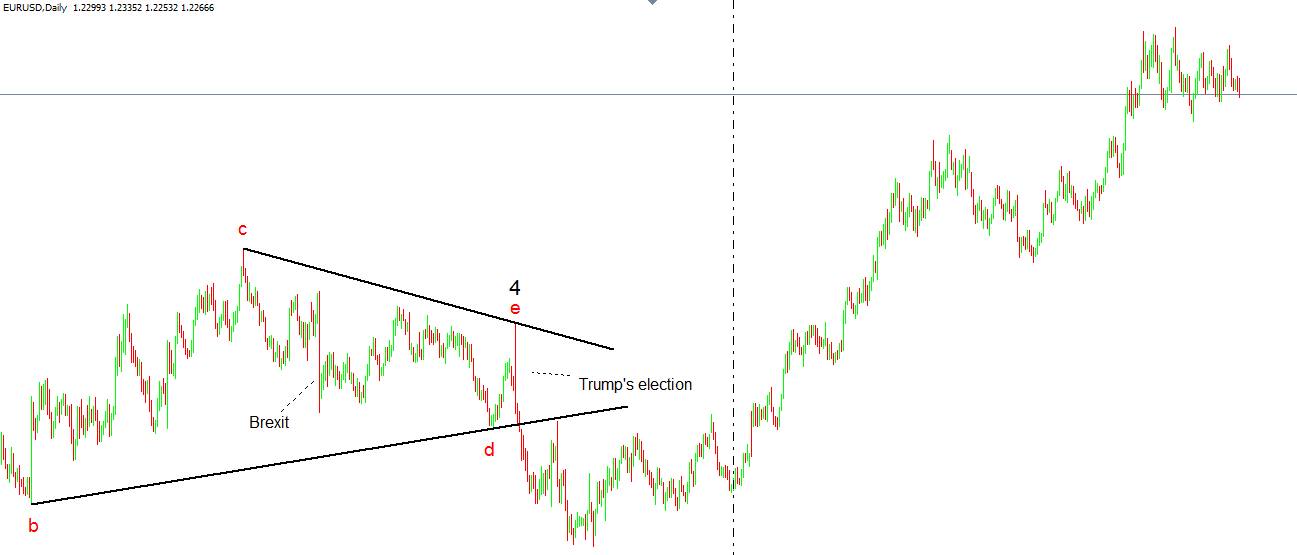
In both cases, savvy traders knew right after the break that the market will turn. Or, that the break lower was a fake one.
How come? In either scenario, the price action to the downside was limited.
The fifth wave of an impulsive move completes the pattern; hence the price will start correcting the bearish trend. A c-wave of a zigzag completes the zigzag pattern; thus the price will correct the zigzag.
So, what happened in the end? The chart below needs no further explanation.
Triangles as Reversal Patterns in Forex Trading
Elliott was the first one to spot a triangle’s potential to reverse a trend. According to his principle, when the price of a financial market reverses from a triangular pattern, the triangle is part of a complex correction.
He identified multiple complex corrections, most of them ending with a triangle. Hence, only by seeing a triangle that formed at the end of a trend, you should know that it is part of a corrective wave, and not an impulsive one.
Perhaps the most relevant examples come from the bigger time frames. And, the EURUSD provides it again.
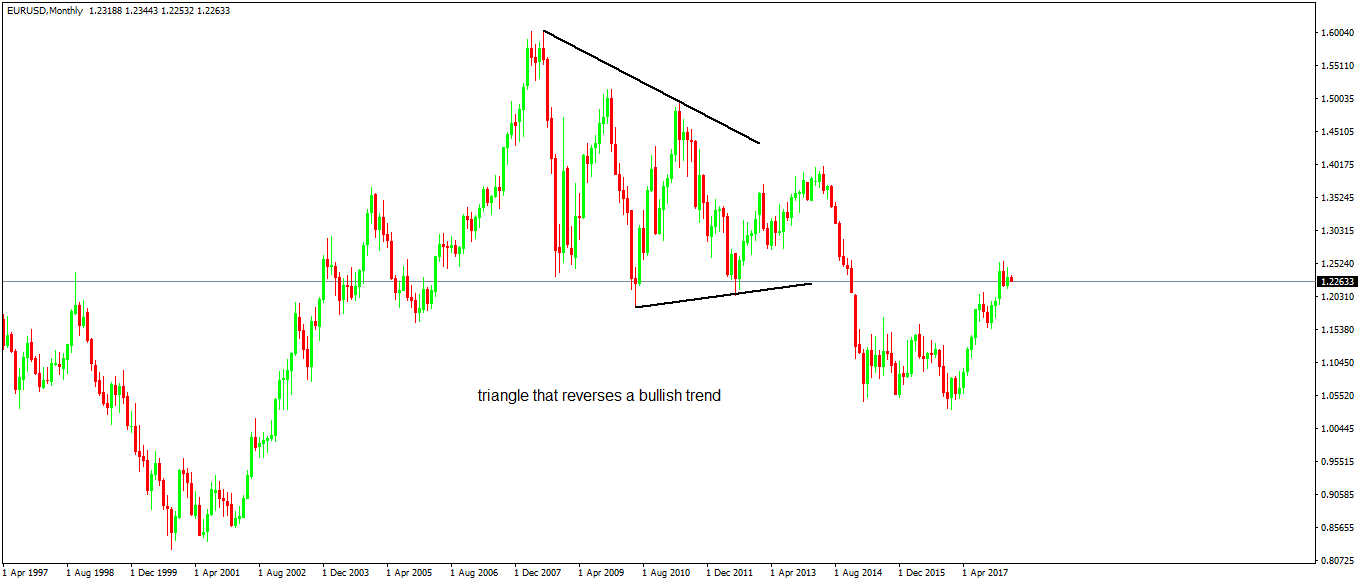
The monthly picture above shows us a triangle formed after the 2008 financial crisis in the United States. Because it broke lower, the entire bullish trend before it MUST be corrective, not impulsive.
Conclusion
This is the second article dedicated to triangles in Forex trading, but it won’t be the last one. In the next section, we’ll carefully analyze different types of triangles and their importance for the Forex trader.
The reason to dedicate so much time to triangular formations comes from their frequency in Forex trading. Traders like to believe that trends often come in Forex trading. That’s inaccurate.
Trends do form, but they are short-lived and take less time than consolidations. Because of that, the focus shifts to understanding the patterns that forms the most, not the ones that seldom appear.
When shifting the attention to triangles, traders discover they are indeed everywhere. Moreover, the only way to understand the complexity of triangular patterns is to study the Elliott Waves Theory and its rules.