

Pattern Recognition in Forex Trading: Double and Triple Tops and Bottoms
As one of the major reversal patterns in Forex trading, double and triple tops and bottoms have a long history. Together with the head and shoulders, wedges and ascending and descending triangles, they form the so-called Western approach to technical analysis.
In other words, they have existed since the birth of technical analysis. Back in the early 1900’s, traders in the United States of America struggled to make sense of various patterns on the stock market.
They started to recorded the market behavior and as a result, beautiful technical concepts, strategies and trading theories appeared. All of them are still around today, and some work in Forex trading too.
Like any reversal pattern, the double and triple top and the bottom show hesitation. The previous trend is exhausted, and traders wait for a sign to trade the other way around.
There is a defined way, with clear rules, to trade the two patterns. We’ll cover that in a bit.
However, the main idea of a double and triple top and bottom is that it shows a support or resistance area. A classic one.
For those that don’t know, support and resistance areas (places where the price finds it difficult to advance or decline) come in two forms:
- Classic support and resistance. That’s a horizontal area difficult to break. The more the price hesitates at it, the bigger the chance it will finally make it through.
- Dynamic support and resistance. Such an area evolves with the price action, meaning it rises and falls with it.
The double and triple tops and bottoms belong to the first category. By the end of this article, you’ll see the advantages and disadvantages of trading them both and how to make the most of them.
Double Tops and Bottoms in Forex Trading
Before anything, keep in mind these patterns were documented on the stock market. That’s very important because the horizontal area they refer to is just that…an area. Not a precise level!
That’s especially true in Forex trading, where currency pairs’ quotation has five digits. It means that fix levels don’t often come as horizontal support or resistance. Therefore, look for an area to define it, a few pips, depending on the timeframe, will do the trick.
Double tops and bottoms appear at the end of a trend. And, they show the price hesitating twice at a level before reversing sharply.
Any pattern depends on the timeframe it forms on. A double top or bottom on a monthly chart has more significant implications on the overall picture than one on the hourly chart.
Nevertheless, they all show reversal conditions. And, there are two ways to trade them:
- Target the measured move.
- Ride a trend after the measured move confirms the pattern.
A double top has the shape of the letter M. It shows the hesitation at the higher levels and, eventually, the price will reverse course.
In contrast, a double bottom has the shape of the letter W. The EURGBP chart below illustrates perfectly how a double bottom looks in Forex trading.
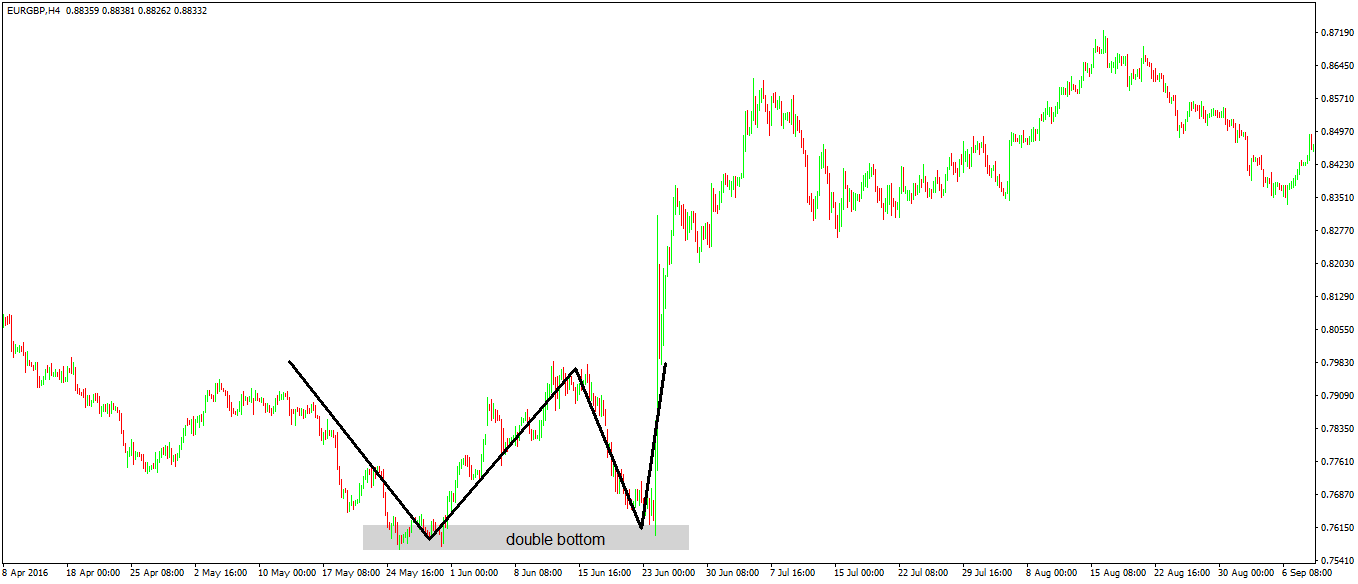
The price falls in a bearish trend, and then a bounce comes. Bulls try to take control.
However, bears push again, without much of a success, though. Next thing you know, the price breaks higher in a healthy, bullish move.
As you can see, the W is not perfect. That’s suggestive for the Forex market, for all the reasons explained earlier.
For the measured move, draw a horizontal line connecting the three points in the W. Next, measure the distance from the double bottom to the horizontal line. Finally, project it higher to find the target.
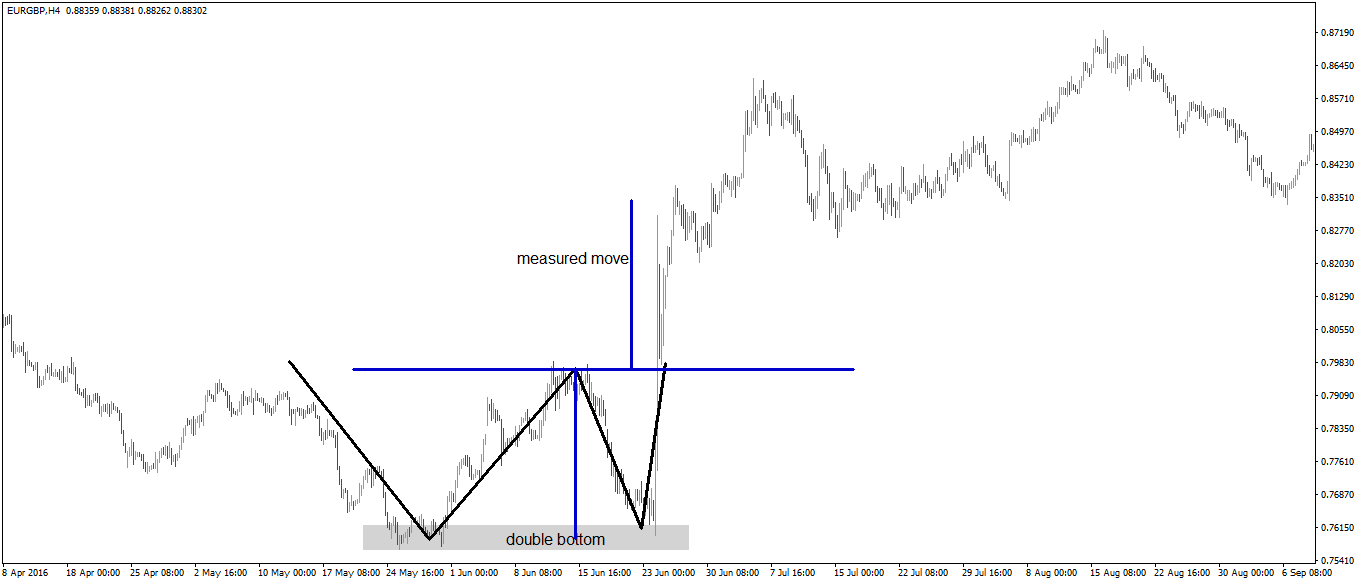
The moment the price confirms the measured move, it confirms the double bottom. Traders know now that a reversal pattern is in place and the focus shifts now to riding the new, bullish trend.
For tips and tricks on how to ride a trend, please refer to the article dedicated to that topic in our Trading Academy.
What if the price comes back for another attempt at the lows? In that case, the market forms a triple bottom.
Triple Tops and Bottoms in Forex Trading
For a triple top and bottom to form, the market needs to push one more time into the same resistance or support area. That’s not something to cheer for!
While many traders look for a triple top or bottom to be even a stronger pattern, it is not. The ability of price to try for the third time should put a shadow of doubt in every trader’s mind.
Even if the price will reverse, and even if the triple top or bottom will have the measured move confirmed, triple tops and bottoms have a tricky interpretation.
Savvy traders know one thing: triple tops and bottoms rarely hold. In fact, they resemble to one of the most common continuation patterns: ascending and descending triangles. More about them in the upcoming article in this Forex trading academy.
Here’s a triple top on the USDCAD chart. The price hesitates at the same area, for three times in a row.
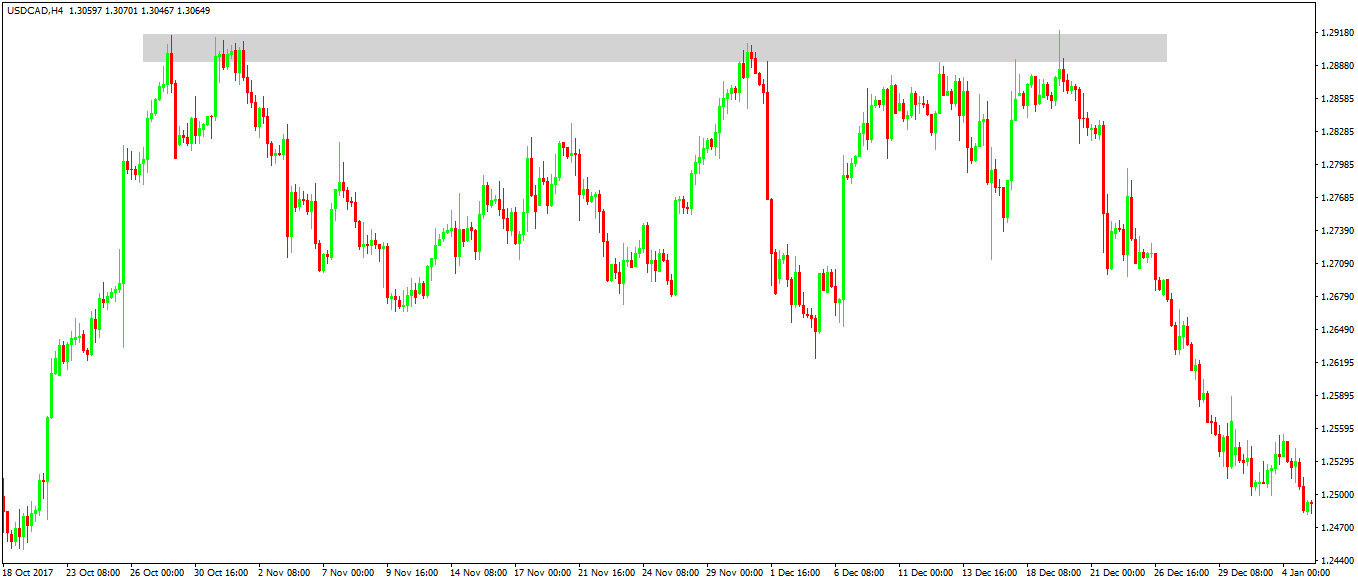
Should it have been only the first two pushes, a powerful reversal was in the cards. However, with the third push, the pattern becomes a triple top, having a different interpretation.
Of course, the classic interpretation resembles the one on the double tops and bottoms: trade the measured move to confirm the pattern.
For this, draw a line parallel with the top, connecting the points preceding the three tops. Next, measure the distance from the triple top to that line. Finally, project it to the downside.
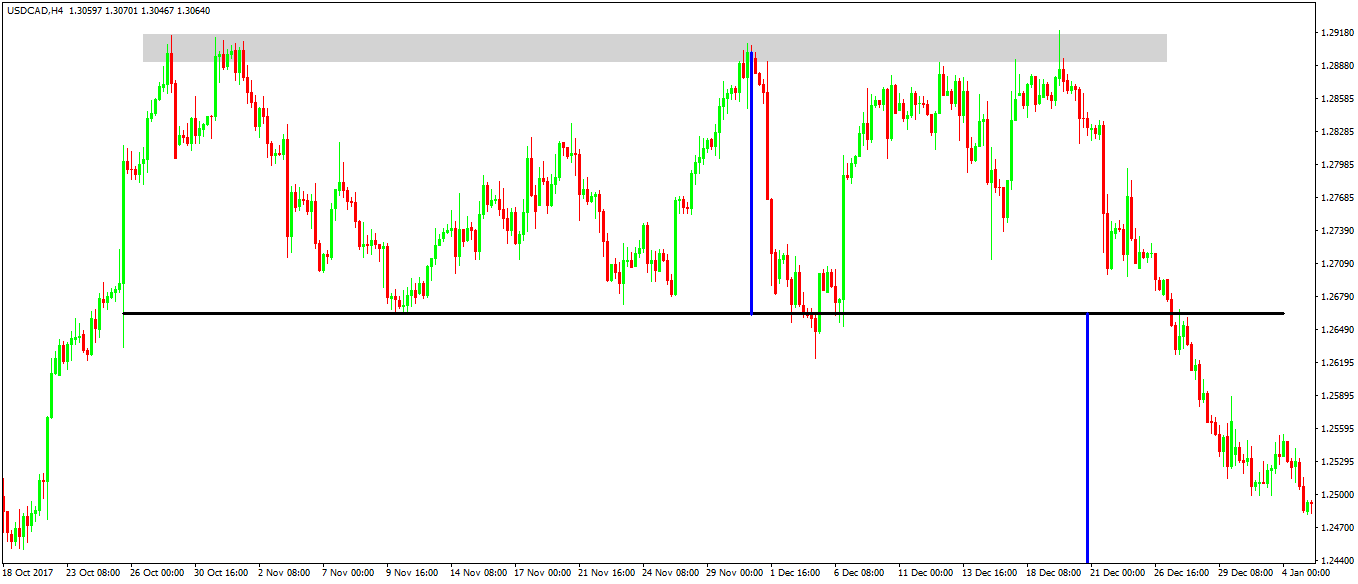
Did the price hit the measured move? Let’s zoom out and find out:
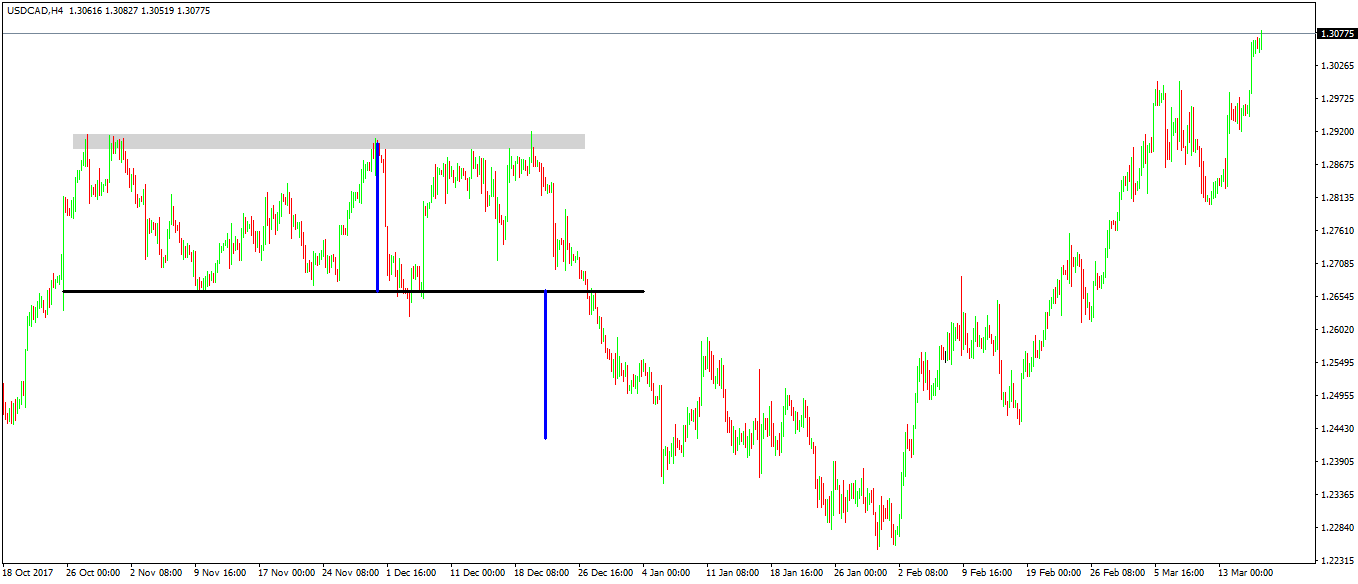
Indeed, it reached it! However, the triple top didn’t signal any meaningful trend reversal, but merely a correction.
After a dip designed to take out weak bulls, the pair surged to new highs, confirming the saying that: triple tops and bottoms rarely hold.
Conclusion
Contrary to the general opinion, in Forex trading the double top and bottom patterns are more powerful than the triple one. A quick reverse signals countertrend strength.
As a rule of thumb, the more the price tries to break a horizontal support or resistance level, the bigger the chances are that, eventually, it will succeed in breaking it.
The examples used in this article were from relatively lower time frames. However, some major tops and bottoms on monthly charts paved the way for incredible reversals.
The most famous one formed on the EURUSD chart. In 2008, right before the financial crisis revealed its teeth, the EURUSD topped at 1.60.
In doing that, it made a beautiful double top around that level, visible on both the weekly and the daily charts. It never looked back since, and almost printed the parity level in the years to come.
The measured move came fast, and the resulting bearish trend lasted for years. It wouldn't mean the same thing if the pair formed a triple top, instead of a double one.
A triple top or bottom resembles a triangular formation. There are many types of triangles to interpret in Forex trading, and the basic shapes are the ascending and descending ones.
Later in the Trading Academy project we’ll deal with other types of triangles too. You’ll see then, that the triple top and bottom is a common pattern in a triangular formation.