

Divergences with the RSI
Developed by Welles Wilder in the late 1900’s, the Relative Strength Index or the RSI stood the test of time to become one of the most popular indicators in Forex trading. There’s a saying that states that every retail trader has looked at the RSI at least one time in his/her career.
The RSI is an oscillator. We’ve covered the most popular oscillators already in one of the previous articles part of this Trading Academy, but only introduced the RSI.
This article aims to detail the use of the RSI further and provide clear examples of how divergences with the oscillator work. As a quick reminder, the RSI:
- Travels only in the positive territory
- Has an overbought and oversold level (70 and 30)
- The maximum values (0 and 100) rarely appear in Forex trading
- The standard interpretation is to buy a currency pair when the RSI dips below 30 and sell it when it reaches values above 70
Like any oscillator, the RSI appears on a separate window, below the actual price. The idea of building an oscillator is to measure the speed and change of price levels.
An oscillator considers multiple periods before plotting a value. The default period for the RSI is fourteen, meaning that the formula for plotting a value corresponding to the current price, used the previous fourteen candles.
Naturally, a bigger period will result in the RSI to flatten. Hence, it’ll lose the significance, as it’ll have a hard time reaching extremes.
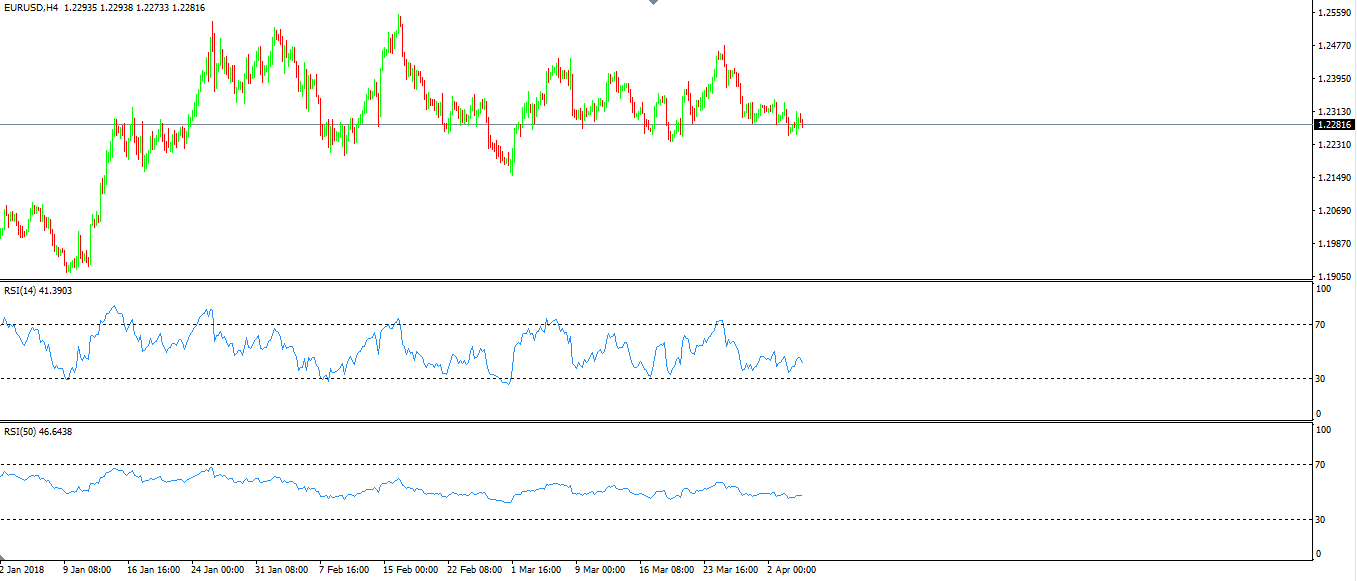
The EURUSD above appears on the daily timeframe. Below, the two windows show the RSI indicator having different periods:
- the one on the bottom has the fifty period
- the one on top has the default fourteen period
RSI (50) fails to reach the extreme levels, making it useless in Forex trading. Thus, the default period works best, and traders rarely change the settings. If anything, they’ll change the default setting with an even smaller period, to consider faster changes in price.
Divergences in Forex Trading
An oscillator follows the moves on the main chart. A divergence happens when the price’s movement doesn’t coincide with the RSI’s move.
The best tool to use here is the higher high and lower lows series. We know by now that this is what makes a trend.
Until the higher highs and higher lows (in a bullish trend) series break, the bulls will keep on winning. Or, as long as the lower lows and lower highs (in a bearish trend) series keeps forming, the market will still fall.
To spot a fake move that the price makes, the focus remains on the higher high (in a bullish trend) series and the lower lows (in a bearish trend). But, traders bring into the equation an oscillator. Apparently, the first choice is the RSI (14).
Because the RSI uses multiple periods to plot a value corresponding to the current price, traders watch for the moment when the oscillator breaks the series. For example, if the price makes two consecutive higher highs, but the RSI doesn’t, that’s a divergence.
In a divergence with an oscillator, traders choose to remain with the direction indicated by the oscillator, not with the one shown by the price. The explanation comes from the fact that the oscillator considers multiple periods (candles) before plotting a value.
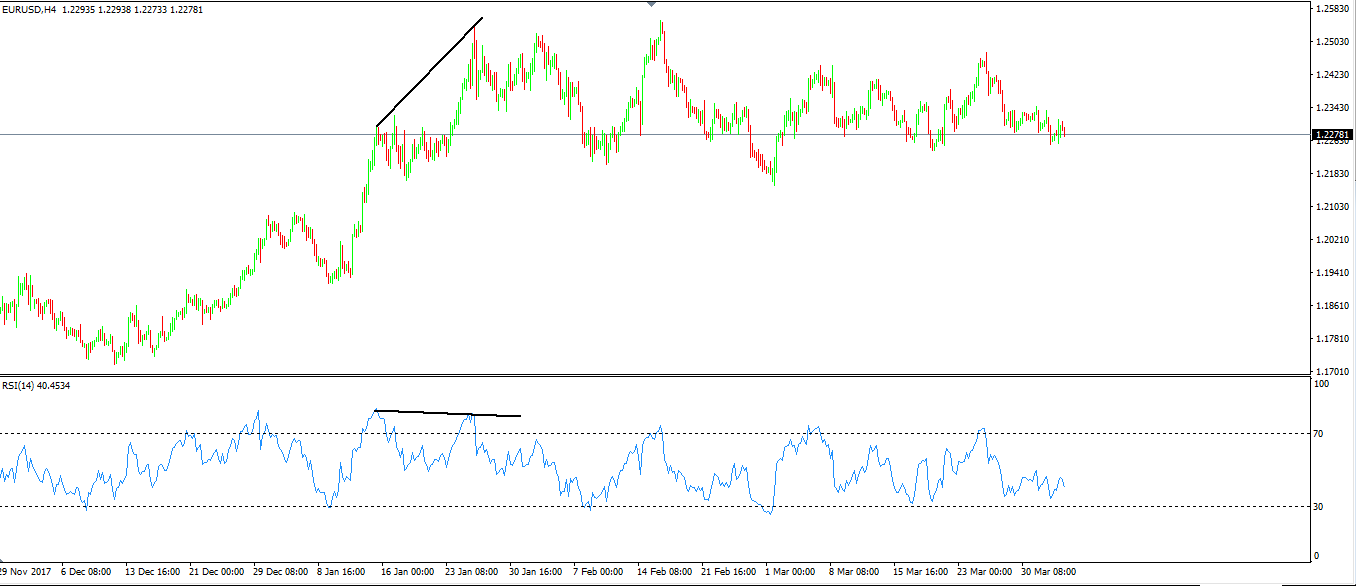
Here’s how a bearish divergence forms:
- the price makes two consecutive higher highs
- the RSI fails to confirm the second higher high
- at least one of the RSI values is above 70, indicating the overbought territory
When these conditions appear, a bearish divergence forms and the bias is to short the pair. In Forex trading, the entry takes place when the RSI moves below the 70 line, and the target for the short trade is the oversold territory.
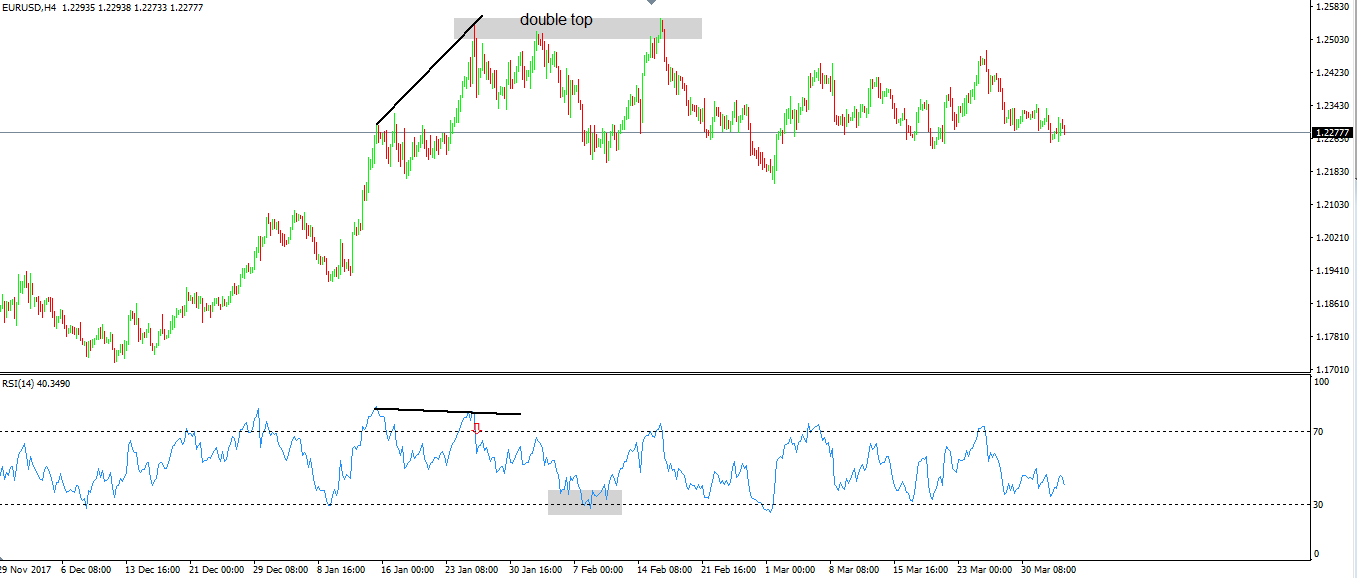
In this case, the strategy worked like a charm. Moreover, after bouncing from the oversold territory, the EURUSD pair formed a double top pattern, with the measured move still open.
It only comes to confirm the previous bearish divergence, as now there’s a confluence of two bearish signals around the same level. The market will have a difficult time breaking above that 1.2530 area.
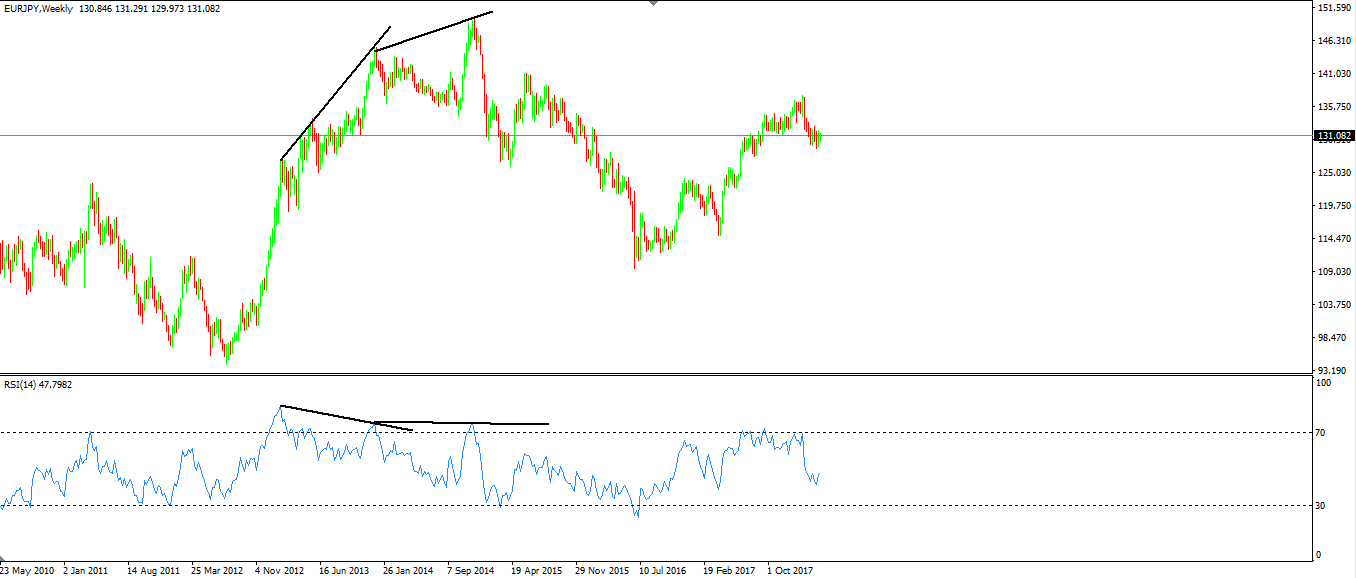
Sometimes, just one bearish divergence is not enough. Strong trends see the market staying in a divergent mode more than a trader can remain solvent.
This is especially true when traders look for divergences on bigger time frames. Fading trends on bigger timeframes is a risky approach for the trading account.
The EURJPY daily chart from below shows the perfect example. The RSI diverged with the price, but then the pair made another higher high, this time with an almost vertical move.
From an emotional perspective, few traders survive a series of bullish weeks like the one below. However, regardless of the reason that created that move, the market formed a double bearish divergence, showing downside potential.
Bullish divergence form as often as bearish ones. And, due to the numerous currency pairs that exist on the Forex dashboard, plenty of opportunities arise.
Tips and Tricks when Using Divergences
The problem with divergences is that robots or trading algorithms spot them too. Hence, when retail trading positions in one direction, usually they’re wrong.
Same side positioning happens when the market forms visible patterns. Or, “by the book” ones.
As such, this is the reason why divergences fail on bigger time frames more often than they fail on lower ones.
One trick is to search for divergences that form before the overbought or oversold territory. Or, ones that have the second spike barely moving into overbought or oversold. Because this happens mostly in a range (when the market forms a bullish or bearish flag, a rising or falling wedge, a triangle, and so on) divergences tend to have a higher success rate.
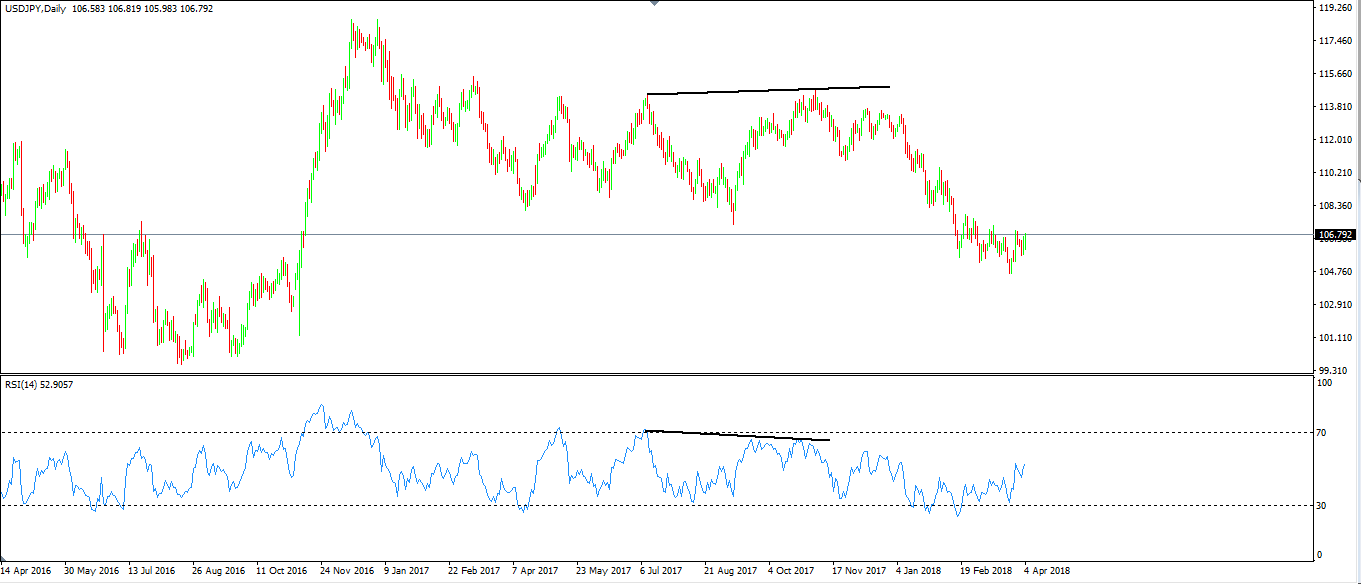
Check the chart below and spot the difference. Compared with the examples showed until now, this USDJPY bearish divergence indicated the exact top.
While not forming that often, such divergences have a bigger impact in reversing a trend.
Another trick is to look for the so-called negative or positive reversals. Such a reversal happens when the divergence forms between the 30 and 70 level, with none of the two lower lows or higher highs breaking the overbought or oversold level.
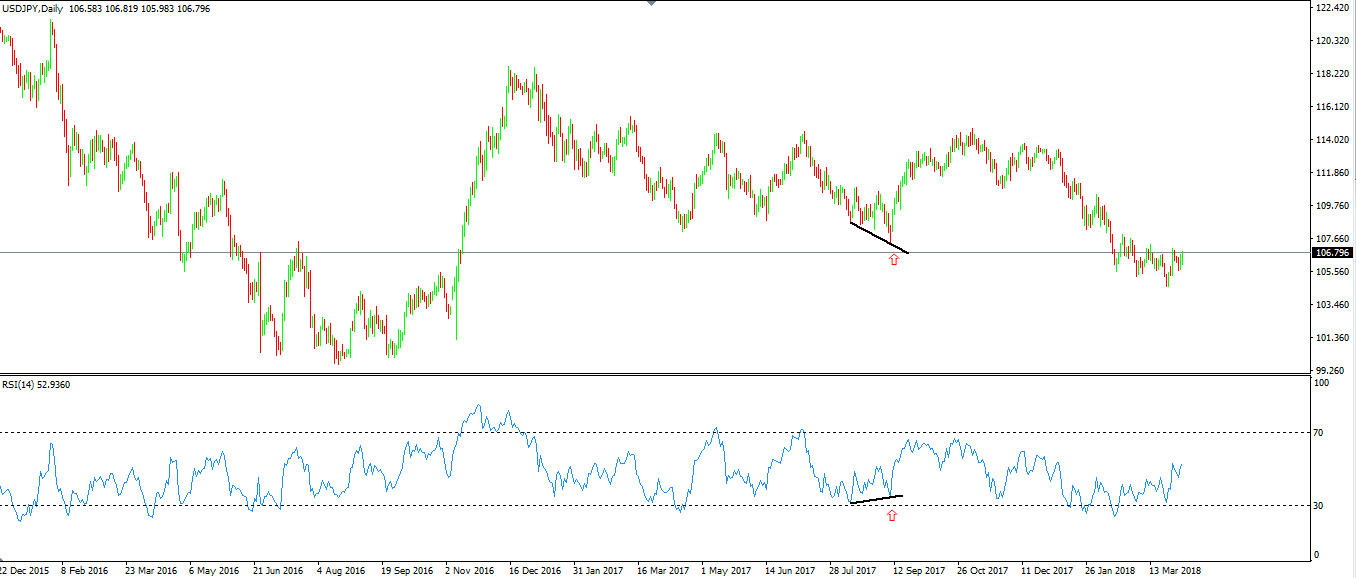
While the price makes a new low, the oscillator denies the second one. However, in doing that, it fails to move below the oversold territory. That’s enough for a positive reversal. A bullish sign just formed.
Finally, one last piece of advice when dealing with RSI divergences: wait for the period to close.
Many times, due to lack of patience and discipline, traders don’t wait for the period to close and judge a divergence before the closing price. That’s a costly mistake as what seems like a divergence, as long as the candle is still open, doesn’t matter. Stay calm, wait for the period to close, and then act.
Conclusion
Divergences don’t work all the time. Any trader knows that.
However, they do signal a potential reversal. And, when they work, the reward is worth the trouble.
Bullish or bearish divergences show extreme levels in a market. They appear either at the end of a range (contracting triangles typically end up with a divergence between the price and the RSI) or at the end of strong trends.
In most cases, traders are already looking for a fake move. When a divergence appears, that’s the signal to enter the market.