

Understanding Japanese Candlesticks: the Doji Candle
Perhaps the most mysterious candlestick pattern, the Doji is just one single candle. Its definition is simple enough for anyone to understand, but it has huge market implications.
Before anything, the Doji candle signals uncertainty. However, it doesn’t only signal a reversal. Sometimes it acts as a reversal pattern, some other times as a continuation one.
In both cases, it shows uncertainty and a market that hesitates. Both bulls and bears wait for the next step.
For a Doji to form, the candle has similar opening and closing prices. This is difficult in Forex trading, as brokers use technologies now that give retail traders exact quotations, on the fifth digit.
Moreover, imagine a Doji candle on the monthly chart, on the EURUSD pair. Assuming the opening price is 1.24034, it is hard to believe the closing price, a month later, will show the exact value.
Plus, not all brokers have the candles closing at the same time. For example, depending on where the servers are located, the four-hour candles close at different times for a broker with servers in New York and one with servers in Eastern Europe.
Therefore, a bit of flexibility never hurts, especially because Forex trading is so liquid. Before the five-digit accounts were available to retail trading, Doji candles looked more accurate on a simple four-digit trading account.
Beware also of the daily timeframe. Some brokers chose to eliminate the Sunday candle from the charts. They just don’t show it anymore.
However, that’s not necessarily correct, as trading does occur on a Sunday in New Zealand and Australia, even if only for a few hours. With a market that isn’t liquid enough, most of the times the Sunday candle looks like a Doji.
For traders using Doji as part of their Japanese candlesticks approach, ignoring the Sunday candles works best in Forex trading. Now that we know Forex trading particularities surrounding the Doji candle, let’s find out what is it that makes the Doji candle so important
Types of Doji Candles
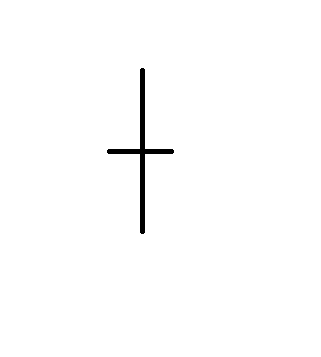
A Doji candle looks like a cross, as shown in the image below.
Depending on where the horizontal line forms, multiple kinds of Doji candles exist. The recent EURUSD four-hour chart formed two gravestone Doji patterns.
As the name indicates, they show bearish reversals, and the pair did retrace over a hundred pips after their formation.
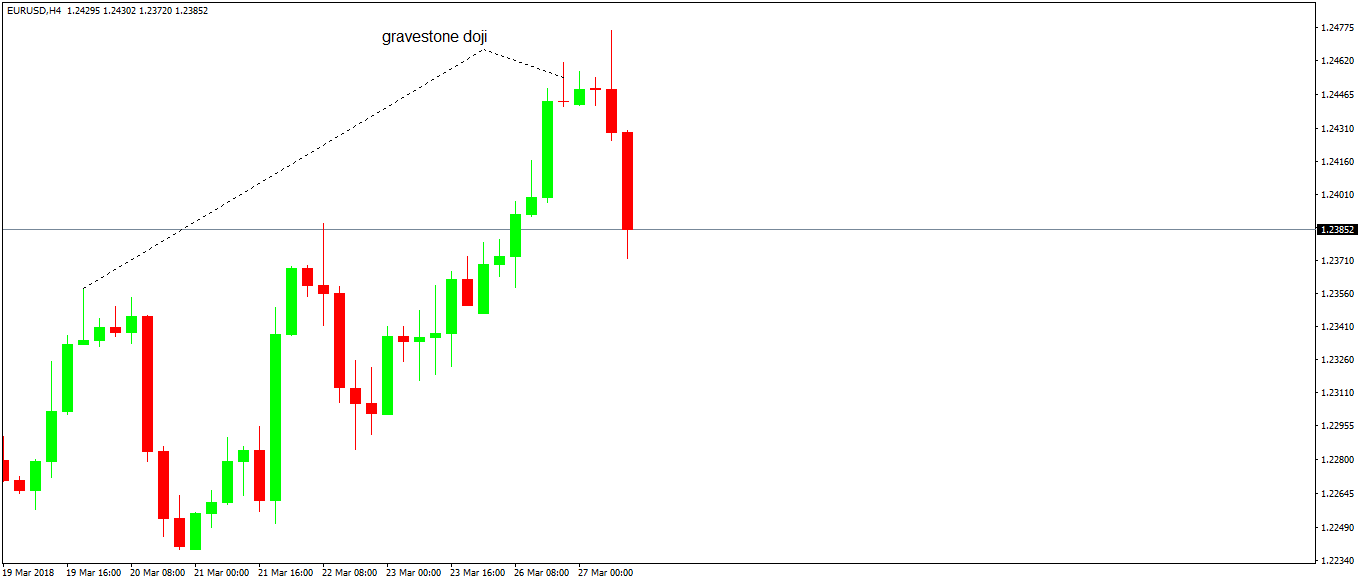
In this case, the Doji candle acted as a reversal pattern. It showed hesitation, the market looked for direction, and the type of the Doji candle indicated the direction.
The opposite of the Gravestone Doji is a Dragonfly Doji. It shows bullish conditions and, naturally, appears during a bearish trend.
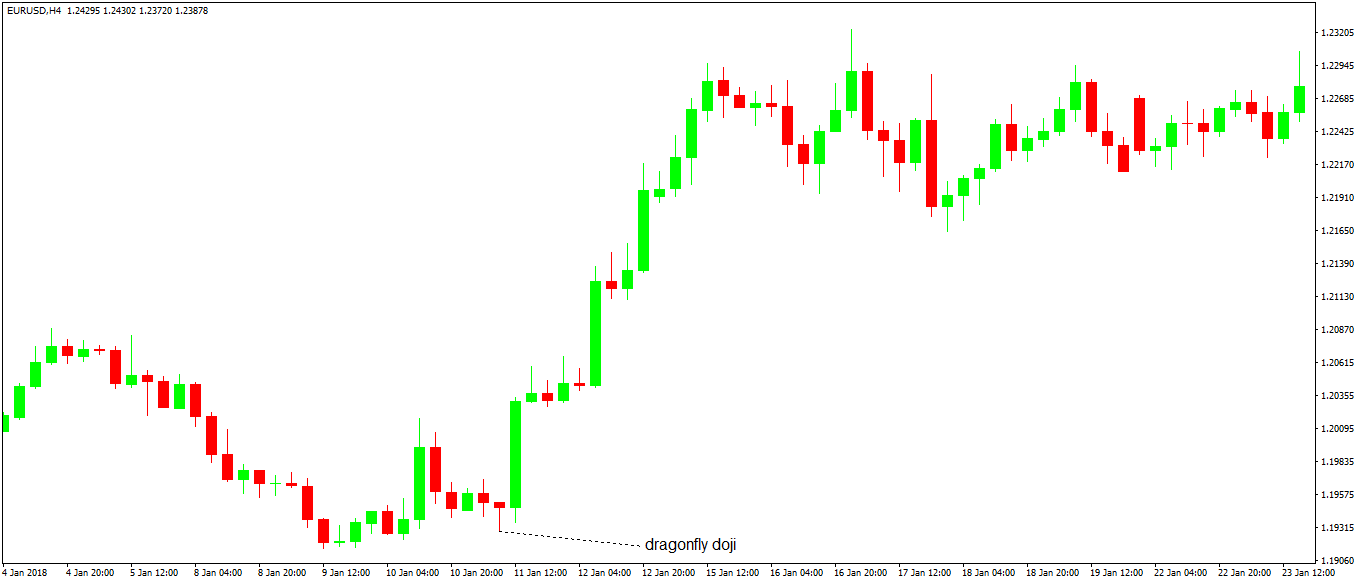
If you check the chart above, you see the dragonfly Doji candle signaling bullish conditions. A quick look at its left and the market formed a candle that looks like a gravestone Doji.
However, because the gravestone Doji indicates bearish conditions, it appears during bullish trends, which doesn’t seem to be the case here. Hence, we can ignore the pattern.
A dominant Doji pattern, the long-legged Doji candle shows both reversal and continuation conditions. If you want, it can act as a breakout indicator. Traders wait for the market to break in either direction before jumping in on the new trend.
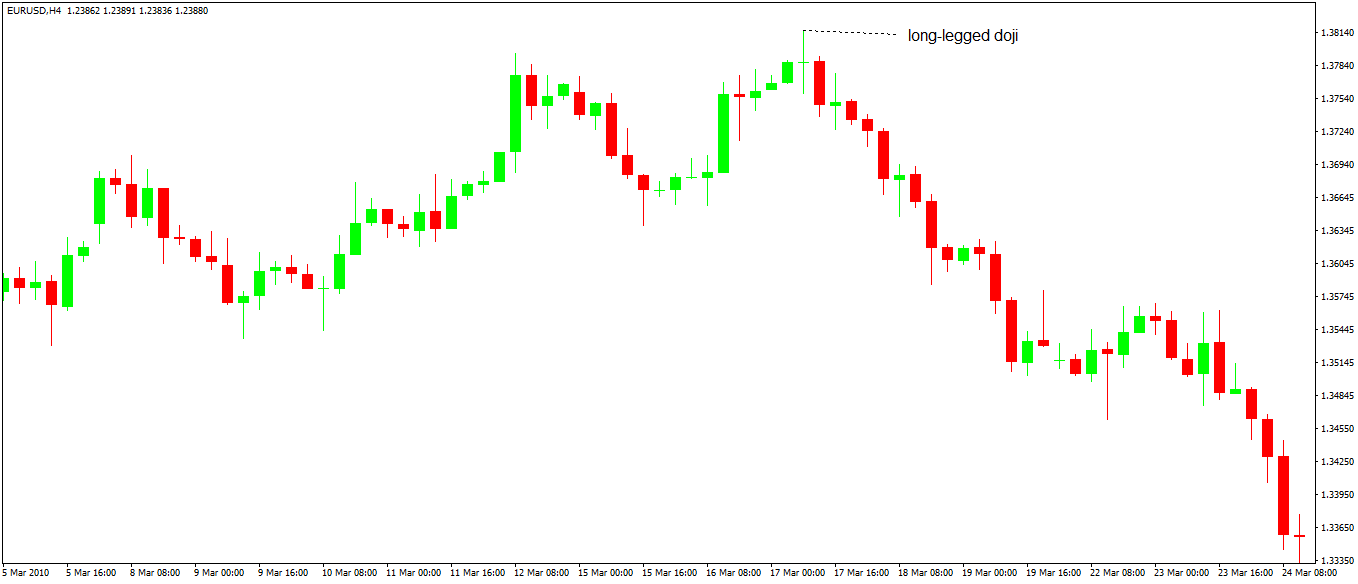
The long-legged Doji candle on the chart above needs no further explanation. After the market broke lower, it never looked back.
Moreover, a quick look on the left side of the chart reveals a double top formation. It comes to reinforce the conviction that the bearish sentiment will prevail and confirms the bearish direction.
Confluence Areas with Doji Candles
Two or more Doji candles in the same area form a confluence level. Either a continuation or reversal place, the break out of it is more powerful than the price action that follows a single Doji candle.
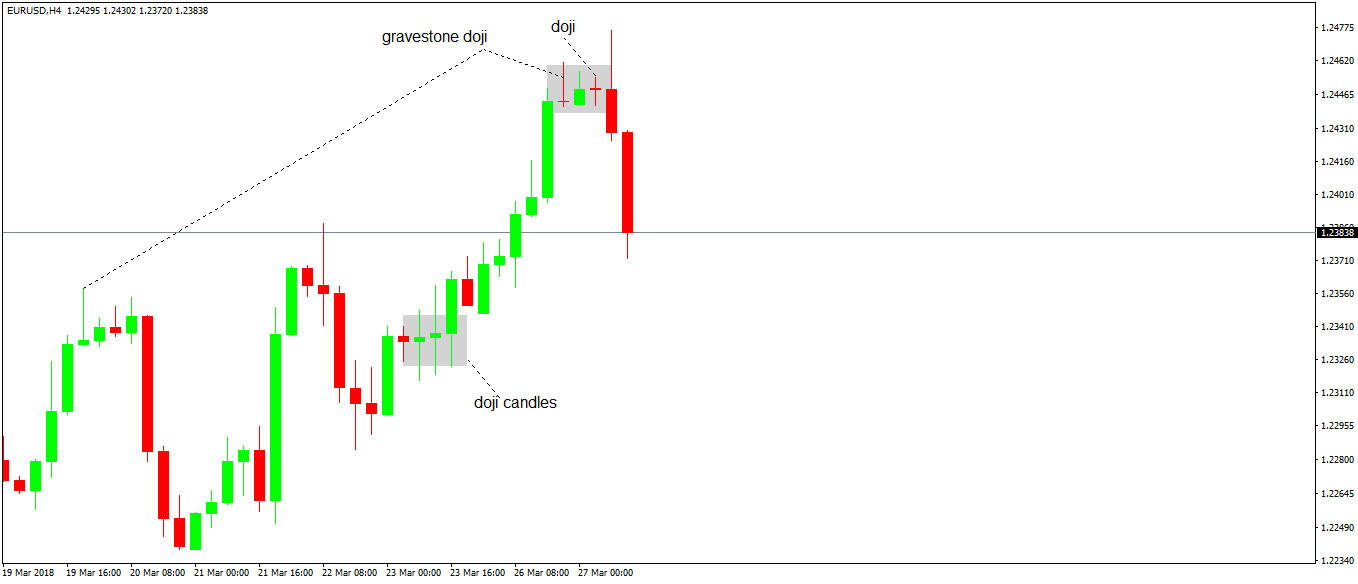
The more Doji candles, the better for the bullish or bearish case. As the chart above shows, the EURUSD struggled for twelve hours (three candles on the four-hour timeframe) before breaking higher.
When it managed to break, a significant rally followed. The same at the top.
The gravestone Doji candle indicated bearish potential. Next, the market forms another Doji candle, a regular one, reinforcing the uncertainty.
However, because of the previous Doji, the bias is bearish, or to go short. Finally, the pair breaks lower.
When combined with other technical analysis patterns, the Doji candles only come to confirm the new trade. Be it part of a double or triple top or bottom, or of an ascending or descending triangle before the break; a Doji candle shows something is about to give up.
Forex Trading Plan for the Doji Candle
Trading a Doji candle follows the same steps as any Japanese candlestick pattern. First, wait for the candle to close, to assess the type of it.
Second, wait for a break, in either direction. Finally, go long or short with the market, placing a stop loss at the lowest point of the Doji candle (in the case of a long trade) or the highest point of it (in the case of a short trade).
As for the target, the appropriate risk-reward ratio of 1:2 or 1:3 is enough for this Forex trading approach.
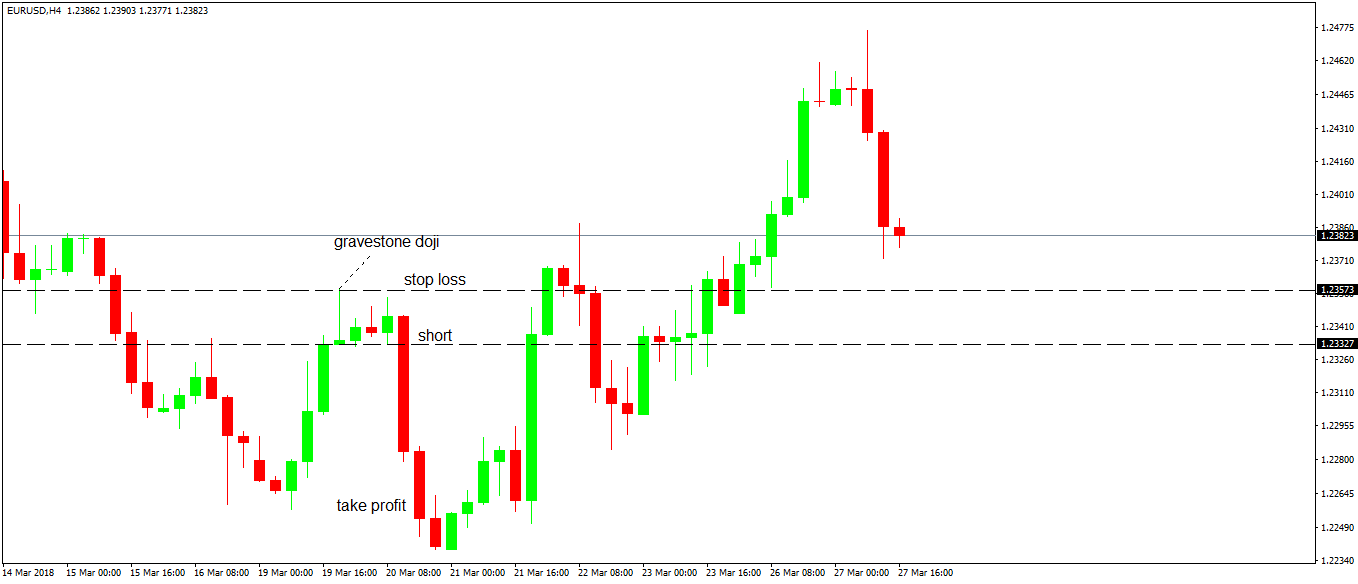
In this case, the gravestone Doji indicated reversal conditions. While bulls tried to overcome the Doji pattern, they failed, and the price eventually collapsed.
The same Forex trading plan applies to all Doji candles. In some cases, the market comes back and hits the stop loss.
However, because of the risk-reward ratio, the chances are that in the long run, the strategy will work. The timeframe used matters too.
For example, trading Doji candles on the five-minute chart don’t make sense. The economic news will affect the stop loss execution.
Hence, stick to timeframes that make sense. Starting with the four-hour charts and up, the Doji candle provides meaningful insights into any market.
Conclusion
The Doji candles come to complete the part in the Trading Academy dedicated to Japanese candlesticks. However, keep in mind that the ones treated here represent only some of them, the most relevant ones.
The subject is a vast one, with concepts like windows, harami patterns, tweezer tops and bottoms, dumpling tops and frypan bottoms, tower tops and bottoms, gapping side-by-side white lines, and so on.
If you think of the fact that the Japanese candlestick patterns existed since the 1700’s, it is only normal to have so many concepts. An in-depth look reveals more reversal patterns than continuation ones, and for this reason, traders around the world find them useful in Forex trading.
The earlier one gets into a trend, the better as the trade doesn’t require a big stop loss and the risk-reward ratio allows for great profits to be made.
What’s interesting is that for every bullish concept, a bearish counterpart exists. Therefore, traders can short a market or go long, using the same idea and trading plan.
Out of all Japanese candlesticks patterns, the Doji candle is the one that has a mysterious aura surrounding it. It shows hesitation, but you won’t know the direction until the market breaks.
But this is more an advantage, rather than a disadvantage. In doing so, the Doji candle “forces” traders to be patient, disciplined and wait until the market moves.
If traders could do the same with all the patterns, results would improve significantly. Still, on the Beginner level in our Trading Academy, we move on with the most famous trading theory among retail traders: the Elliott Waves Theory.