

Elliott Waves Theory: Different Types of Flats
The Elliott Waves Theory interprets the pessimism and optimism in financial markets to forecast the next higher or lower swing. An ingenious approach to technical analysis, the Elliott principle claims to have found “the secret of the universe,” as Elliott proudly called the last version of it.
Elliott dedicated an essential part of his life to this theory. Encouraged by the accuracy of the forecasts he made on the stock market, he never gave up until the theory was completed.
Because the theory was developed before 1950’s, the testing playground was the stock market. As such, non-believers argue that the Elliot Theory won’t work in today’s Forex trading as the two markets are entirely different.
However, the theory discusses more human nature and the psychological approach to trading. It sums up what people feel and do in the trading arena. Moreover, it changed the way technical analysis works, as many other theories don't treat the psychological component.
Elliott divided the market patterns into cycles. And each cycle has two phases: an impulsive and a corrective one.
Together, they are labeled as 1-2-3-4-5 – a – b – c. That’s the basic count of an Elliott cycle.
The trick is that there are many types of impulsive waves and even more types of corrective ones. Elliott had a hard time categorizing all corrective waves, and so the starting point was to split them into two other categories: simple and complex corrective waves.
Flats as Simple Corrections in Forex Trading
The Elliott Waves Theory won’t work without Fibonacci ratios. In fact, Elliott found them so useful that he used them as the main tool to differentiate between various market patterns.
A quick reminder what a flat is:
- Three-wave structure
- Labeled a-b-c
- Waves ‘a’ and ‘b’ have a corrective nature
- Wave ‘c’ has an impulsive activity
- Wave ‘b’ retraces more than 61.8% of the previous wave ‘a’
The golden ratio holds the key to defining the types of a flat. Therefore, based on the b-wave’s retracement into the wave a’s territory, Elliott found three types of flats:
1. with a weak b-wave
A flat with a weak b-wave shows the inability of the b-wave to retrace more than 80% of the previous wave ‘a’. Traders use a Fibonacci ratio to measure the length of wave ‘a’ and find the 80% level.
More precisely, the b-wave must end between 61.8% and 80% of the previous wave ‘a’. If that happens, the market forms a flat with a weak b-wave.
2. with a normal b-wave
When the b-wave retraces between 80% and 100% of the previous wave ‘a’, the flat is called a flat with a normal b-wave.
3. with a strong b-wave
The b-wave can retrace much more than the 100% level. It can go over 138.2%, 161.8% or even more. In this case, the pattern has a strong b-wave.
Elliott found that the length of the b-wave is decisive in categorizing the upcoming move. In other words, if the market forms a flat with a weak b-wave, there are a few patterns of a bigger degree where that flat appears in an Elliott cycle.
Or, if the pattern has a strong b-wave that retraces more than 161.8% of the previous wave ‘a’, the c-wave to follow cannot retrace the entire b-wave. As such, the entire Elliott theory is just a logical process. It implies the next step based on what the current market does.
Forex trading is full of swings that easily fit a flat pattern. All one has to do is to check for the impulsive activity in a move. Because impulsive waves aren’t that common, the logical Elliott process tells us that the move is most likely corrective.
Introducing the C-Wave into the Puzzle
So far, we’ve split the flat patterns into three categories, based on the b-wave’s length. Furthermore, in each group there are three types of flat patterns.
The c-wave’s length gives the type of the pattern, while the b-wave indicates the category. So, in the first category, three situations exist:
- the c-wave fails to retrace the entire b-wave
- the c-wave ends between 100% and 138.2% of the previous b-wave
- the c-wave extends beyond the 138.2% level
Remember that the c-wave is the only segment in the flat pattern that has a five-wave structure. Or, is an impulsive wave.
Each situation mentioned above results in a different type of flat that belongs to the weak b-wave category:
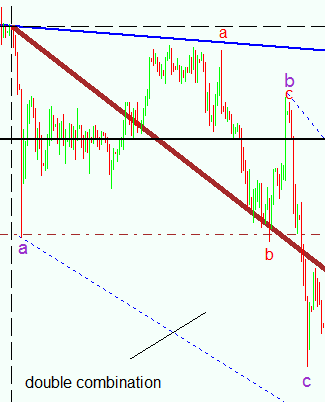
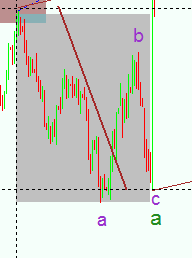
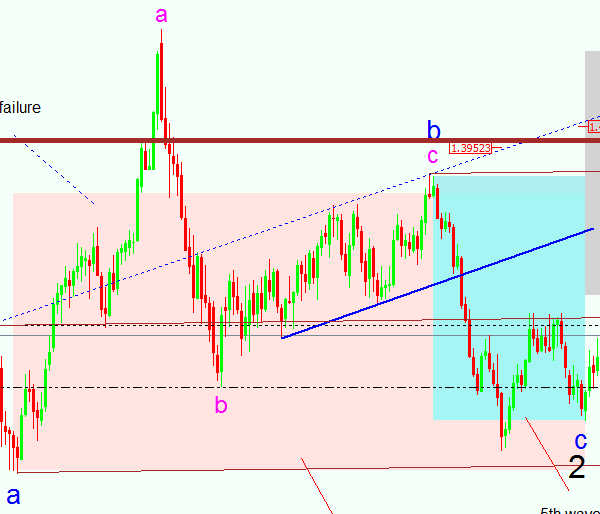
- flat with a double failure
- flat with a b-failure
- elongated flat – the a-b-c in purple, part of a double combination of a similar degree
In the second category, the same three situations exist:
- the c-wave fails to retrace the entire b-wave
- the c-wave ends between 100% and 138.2% of the previous b-wave
- the c-wave extends beyond the 138.2% level
Based on them, the corresponding flats are:
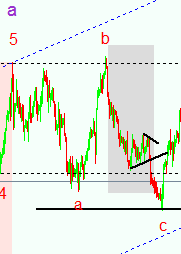
- flat with a c-failure
- common flat
- elongated flat
Finally, the flats in the third category starts from the same premise:
So, in the first category, three situations exist:
- the c-wave fails to retrace the entire b-wave
- the c-wave ends between 100% and 138.2% of the previous b-wave
- the c-wave extends beyond the 138.2% level
As such, the corresponding flat patterns are:
- irregular flat
- irregular failure
- elongated flat
The three possibilities for the c-wave’s length are determinant for the type of the flat. This is the reason why they are mentioned ahead of every flat category.
Besides the nine types of flats explained here, there’s one more: the running flat. The running concept is often misunderstood, and we’ll spend more time explaining it in a different article in the Trading Academy.
Every type of flat from the ones mentioned above indicates something. For example, the flats with a failure, indicate the countertrend’s strength.
Therefore, if the flat is a bearish correction or part of a bearish correction, its simple presence signals bullish conditions.
Between the flats that fail, the one with the double failure is the most powerful. The inability of the b-wave to retrace beyond the 80% level and the c-wave to fully retrace the b-wave, leave room for an explosive move in the other direction.
Conclusion
Flat patterns are the most numerous patterns that Elliott found. This is visible in Forex trading too.
If there’s a pattern found most often, that’s the flat pattern. Just open a regular Forex chart and see the swings in both directions, taking the previous highs or lows, only for the market to quickly retrace. Those are flat patterns.
Depending on where a trader is with a count, flat patterns may or may not validate the bigger degree analysis. For example, if a trader expects an impulsive move, but the market starts with the first swing being corrective, it means that somewhere there is an error.
Or, if the trader expects a triangle but one of the segments is impulsive, it means that segment is the c-wave of a flat. Hence, no triangle exists.
The entire theory is full of such examples. After all, it is a logical process that starts with answering one question: is one market swing impulsive or corrective.
If the answer is corrective, the next question is what kind of a corrective wave is? If there’s a flat, what category and what type of a flat?
This way, excluding all possibilities, the trader remains with the right interpretation of a market cycle. When part of a top/down analysis, the logical process starts from the monthly chart and ends with the four-hour and the hourly timeframe.
It is the only way the Elliott Waves Theory works in Forex trading.