

The Basis for Trading with Gann
Just like Elliott and Gartley, W.H Gann comes from the same “golden” technical analysis age: the early-mid 1900’s. To this day, he remains famous for his market calls well before the events took place.
Before moving forward, you must know that Gann’s work has a mystique aura. More than a hundred years later after he started trading, his works were misinterpreted, lost, and, in some cases, found again but with missing parts.
Like any good movie, the story of Gann and his contribution to technical analysis ends up with traders still seeking for the holy grail in Forex trading, based on Gann’s approach. This article aims to present his views on financial trading, what made his approach unique, and what current trading platforms offer from the original Gann tools.
Gann started trading in 1902, and many of the markets he traded don’t exist anymore today. He was a strong believer that everything happens for a reason, and his entire career he tried to find out historical prices for everything he traded.
He even traveled to Egypt to find out historical prices for some of the commodity markets he was interested in trading.
Gann strongly believed in numerology and astrology, and often used astrology to interpret crowd behavior. Concepts like how the full moon and half moon affects mass psychology aren’t new in today’s world. As such, what is the place to profit from changes in crowd behavior? You guessed it: the financial markets.
After his death, many tried to take his work to the next level. Unfortunately, little amount of information available, or the complicated way in which it was presented, made understanding Gann very difficult.
Today’s Forex trading is something that didn’t exist when Gann became famous trading the stock and commodity market. Yet, some of the concepts he invented make sense in the currency market too.
For this reason, trading platforms incorporate some Gann tools with the default settings. However not all, for example, the Gann Wheel doesn’t appear in the original MT4 settings.
Gann used “the wheel” he invented to find out the next degree for the angle of the rising or falling trend. For you see, Gann believed that every single financial security has its own rising and falling angle. Even when they belong to the same market!
In today’s Forex trading, it means that every single currency pair, major or cross, will have a different rising and falling angle. The concept, known as the 1x1 line, still fascinates traders trying to unlock the secret of Gann trading.
Gann was the first one to introduce the price and time concept when trading financial markets. To this day, it remains the holy grail in Forex trading: knowing not only where the price goes, but when, also!
Trading with the Gann Fan
Perhaps the most famous Gann tool is the Gann Fan, offered by most trading platforms, MT4 included. The tool is a set of lines, nine lines to be exact, that start from the same point, but have different angles.
Apparently, the most important line and the one in the middle is the 1x1 line mentioned earlier. Having the 45 degrees angle associated to it, the 1x1 angle represents one unit of price for one unit of time.
The other lines of the trading tool sit above and below the 1x1, being called 2x1, 3x1, and 4x1. It merely means that it moves two, three, or four units of price per one unit of time.
In Forex trading, many make the mistake of using the timeframe’s period as the unit of time. Gann had a different way to calculate the time for each financial security. Hence, in today’s Forex trading the challenge comes from how to set up the angle for the 1x1 line so that the projected lines offer dynamic support and resistance levels.
The starting point is known: the change or reversal of a trend. However, if you check the MT4, you’ll see the Gann Fan tool has three different points.
The first one is the starting point. Or, the top or bottom of the previous trend.
The key is where to place the third point, so to establish a rule to use in future trading setups too. And, the right answer comes from the series of higher lows and higher highs that define a bullish trend and lower highs and lower lows in the case of a bearish trend.

The chart above shows the recent AUDUSD daily timeframe. The first point sits at the bottom of the previous trend, and the third one where the grey circle is.
That’s the 1x1 line that defines the bullish trend. Before saying that it doesn’t correspond to the 45-degree angle, you need first to study how charts are built in the modern technical analysis. That’s another story, not for this part of the Trading Academy.
In any case, the Gann Fan projects the nine lines into the future, indefinitely, providing crucial dynamic support and resistance levels.
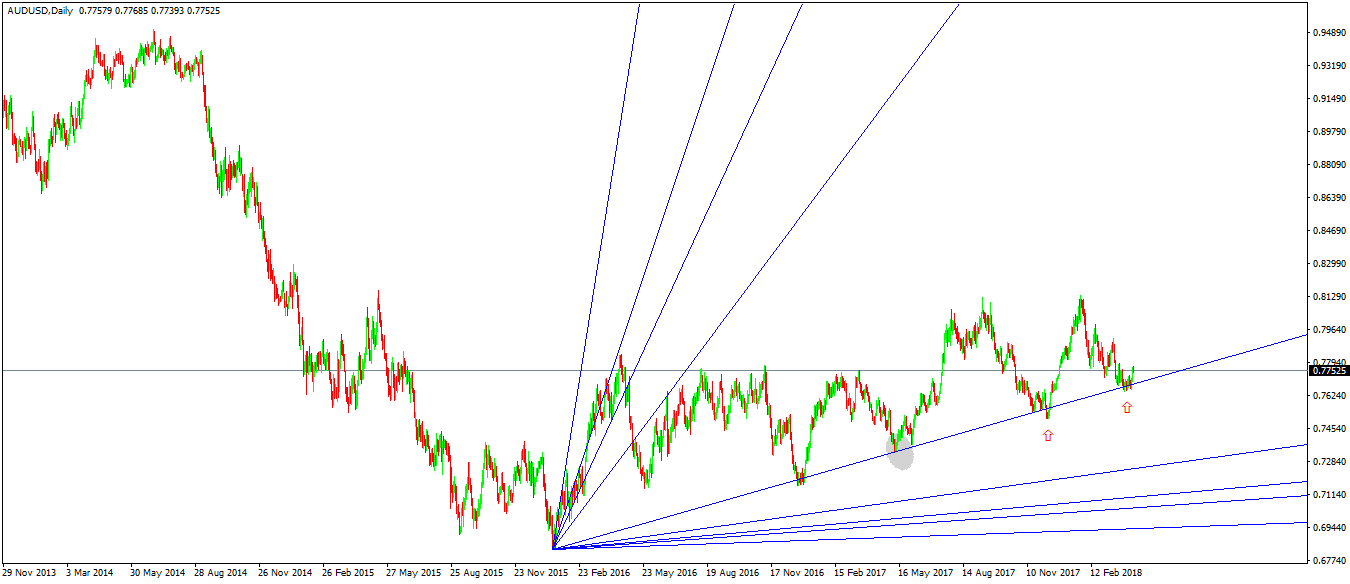
In this case, it offers dynamic support, as visible in the chart above. If broken, the line turns into dynamic resistance.
If we are to interpret the words of W.H. Gann literally, we need to apply the Gann Fan at the end of a move, which may or may not be the absolute top or bottom.
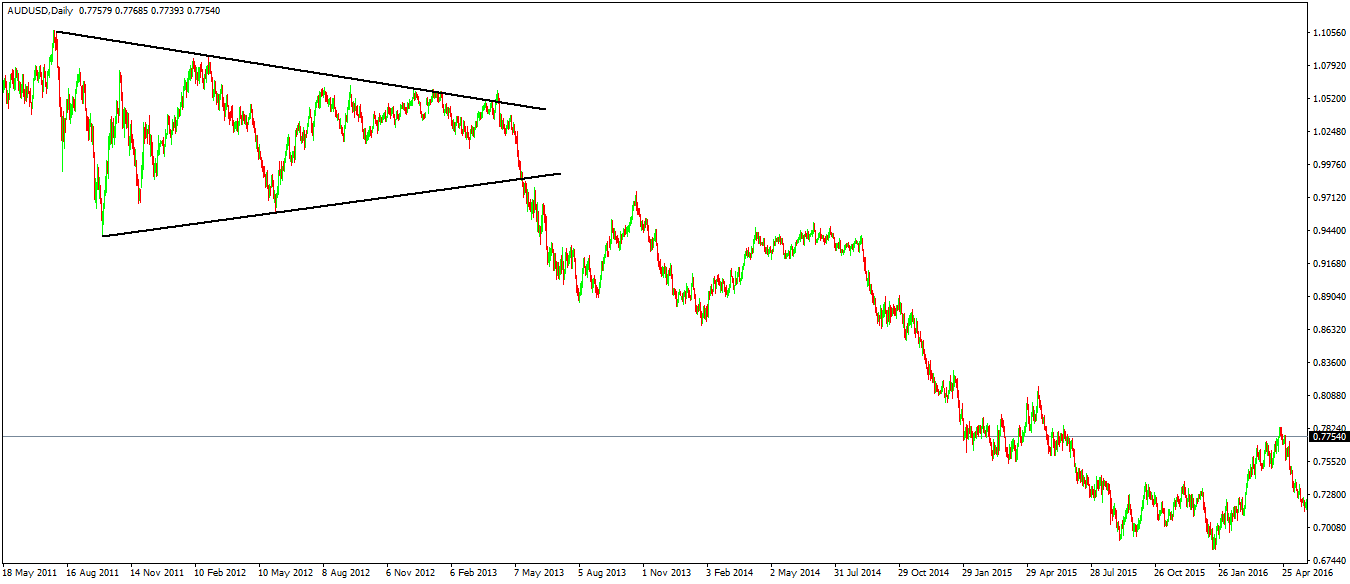
Elliott shared the same way of thinking, believing that impulsive and corrective waves aren’t mandatory to start from bottoms or tops. Using this logic, let’s focus on the bigger picture on the AUDUSD pair.
The pair dropped from above parity at the start of 2013. In doing that, the pair fell from a triangular pattern. That marks the end of the previous trend, so that’s where the Gann Fan tool that defines the new bearish trend should start.
Having said that, and following the same principle, we can draw the tool by setting the 1x1 line and the next lower high before the price making a new lower low.
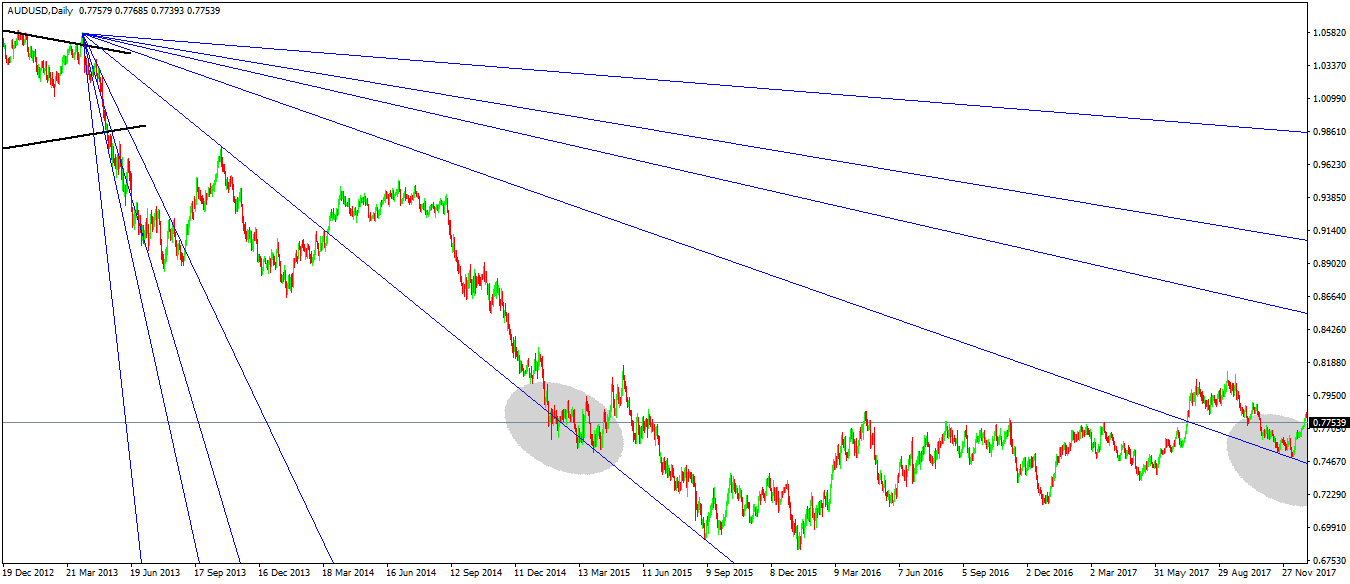
During a downtrend, if the price remains below the 1x1 line, bulls have no reason to look for a reversal. However, in this case, it broke above shortly after it made a new lower low.
While the bearish trend continued on this timeframe and on lower ones, bulls had what they needed! Conditions for a reversal are in place, and the 1x1 line will now act as dynamic support.
Being dynamic, even if the market continued to drop for a while, the rejection came from the second time the 1x1 line was tested. The bear market ended, and for the next three years, the AUDUSD pair slowly started to grind higher.
Conclusion
The Gann Fan is only one trading tool from the entire legacy W.H. Gann left to technical analysis. The reason it is presented it in this part of the Trading Academy is that it is the simplest one and to use it in Forex trading follows a logical process.
But still, the way it is used in Forex trading differs from Gann’s original way. Moreover, Gann used multiple trading tools on the same market, working together to forecast the future price of a financial security.
The Gann Grid, Gann Wheel, and, of course, astrology and the way planets affect human behavior; they were all a central part of any analysis.
We like to think that, if technology is everywhere around us these days, the work of Gann, Elliott, Gartley and alike, is simple to program and decipher.
However, before programming, we need to properly understand the theories of the past, to unlock the future.