

Gartley and When Harmonics Started
Many believe that the Gartley pattern is the most powerful pattern in financial markets. It is no wonder it was embraced wholeheartedly in Forex trading too.
To give you an idea of the extent of it’s usage, traders built Expert Advisors in the form of active indicators to spot the Gartley pattern on any chart and alert you when it forms. However, before trading it, one needs to know the rules and how to make the most of it in Forex trading.
Just like the Elliott Waves Theory, the Gartley method or approach to financial markets was born in the same period: the middle of the 1900’s. Thus, it belongs to the Western approach to technical analysis, in a period when trading took place mainly on the stock market and a few other commodity markets.
Another similarity comes from the tools used. Both Elliott and Gartley theories intensively use the Fibonacci ratios.
And, in time, both Elliott and Gartley theories were taken to a different level by avid followers that adapted the initial conditions to fit different market realities.
Here’s how it all started…
H. Gartley and the “Profits in the Stock Market”
Born in New Jersey in 1899, Harold Gartley was a real economist, earning an MBA from New York University. He was fascinated by financial markets and crowd behavior, which ended up being at the core of his trading theory.
While working in the financial field for years, Gartley started to teach and gave lectures on technical analysis. Eventually, he put everything together into a course called “Profits in the Stock Market.”
To this day, it remains one of his best works, even though his contributions to technical analysis extended to other areas as well. Judging by the price he asked for the course (over fifteen hundred dollars in the middle of 1900’s), you can get an idea as to how valuable his views were to the financial world.
For example, his work extends to moving averages, contributions to the Dow Theory, and triangles, among others. But he ended up being famous for the simplest pattern he documented: the Gartley pattern.
The Gartley Pattern
The beauty of the Gartley pattern and why it still works in today’s Forex trading comes from the great risk-reward ratio it offers. Whenever a trading setup allows for a hefty risk-reward ratio, traders should focus on mastering it.
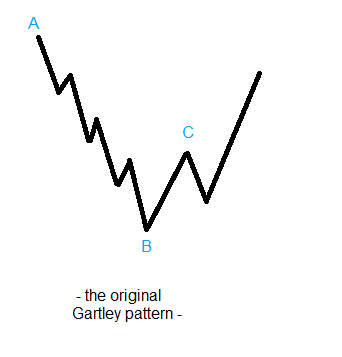
Gartley's idea started with what the general sentiment in a trend is. For example, in a bearish trend, the market keeps forming a series of lower lows and lower highs.
Until the series holds, there’s not much that bulls can do. That is the A-B segment in the original Gartley pattern.
Suddenly, a rally forms, taking the previous lower high. That’s the B-C segment and the confirmation that a Gartley pattern might form.
When this happens, typically traders start to cover their short positions. As a reminder, in Forex trading and in any kind of trading, all positions must be squared in the end.
For example, if you go long and the market rises, to mark the profit you must close the position. When doing so, you sell or square the initial long, and the difference represents the profit.
The same in short covering. Shorts enjoyed the ride, and now they’re booking profits, by buying to square the short positions. When the short covering ends, the B-C segment ends too.
According to Gartley, a minor decline follows, but the lows in point B must hold. The minor drop might be due to late bears or traders willing to stay in the market for different reasons.
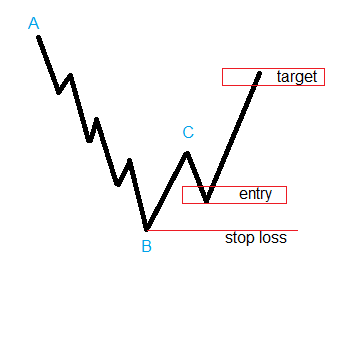
With that in mind, the trading setup goes like this:
- Enter long on a 38.2% - 50% retracement of the B-C segment
- Stop loss at the bottom of the B level
- Target 61.8% retracement of the original A-B segment
In a bullish trend, the idea remains the same, only that traders look to short a currency pair.
Hence, the trading setup becomes:
- Enter short on a 38.2% - 50% retracement of the B-C segment
- Stop loss at the top of the B level
- Target 61.8% retracement of the original A-B segment
It may sound easy to approach the financial markets like this, but again, the focus sits with the statement from the start of this article: the Gartley original pattern offers excellent risk-reward ratios, of at least 1:2.5 or 1:3.
A risk-reward ratio like this suits Forex trading well, even though robots dominate the price action on any given day. Because Forex trading is a game of probabilities, such ratios allow for loss-taking, while the account keeps growing.
Original Gartley Pattern in Today’s Forex Trading
Many traders wonder if theories like the Elliott Wave or the Gartley approach work in today’s Forex trading. Because these theories deal with crowd behavior, they still work indeed.
Here’s an example of the EURUSD recent price action in April 2018, where we apply the same rules as described by Harold Gartley almost three-quarters of a century ago.
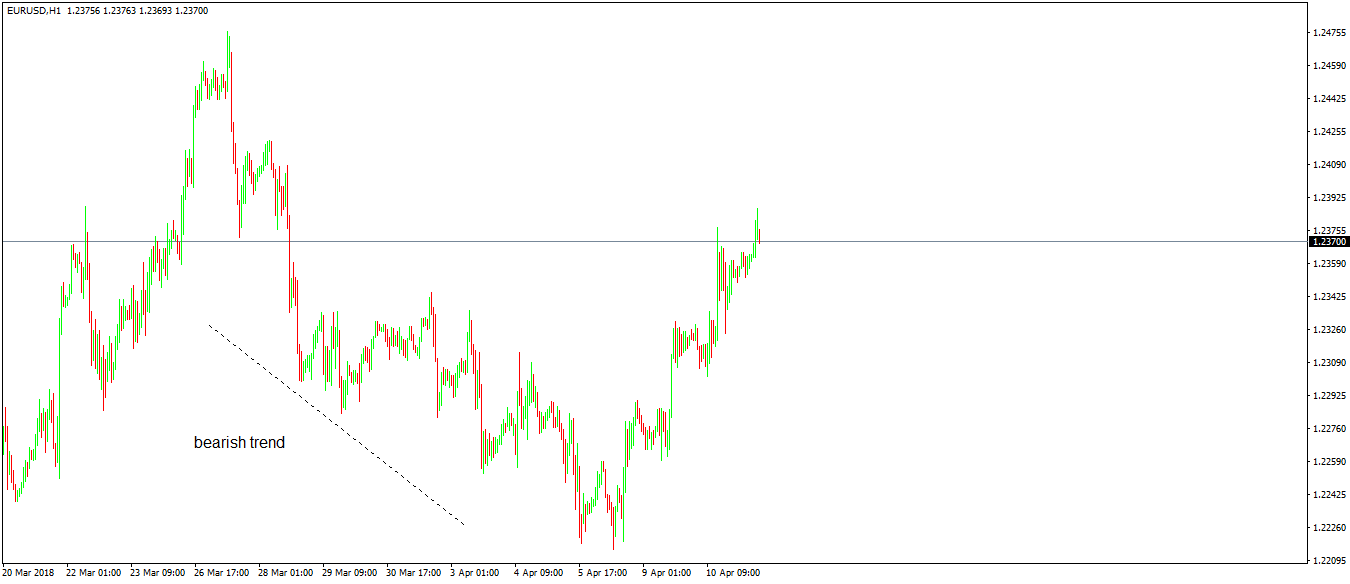
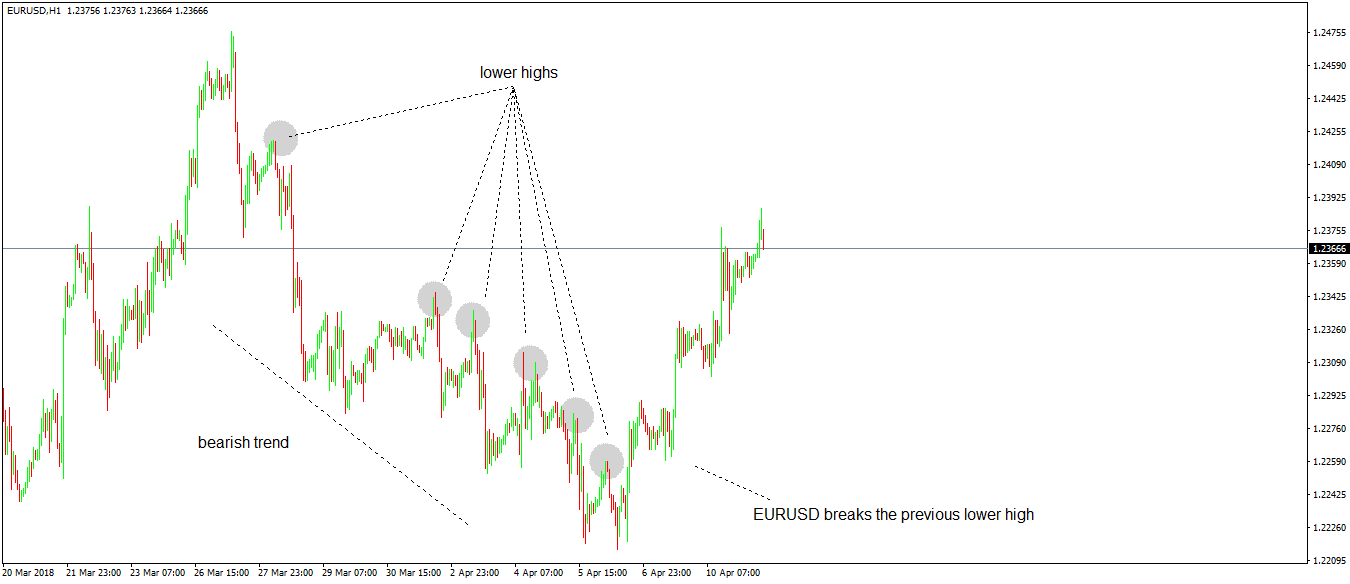
The EURUSD moved lower in a clear bearish trend. The next thing to do is to identify the lower highs series that defines the trend.
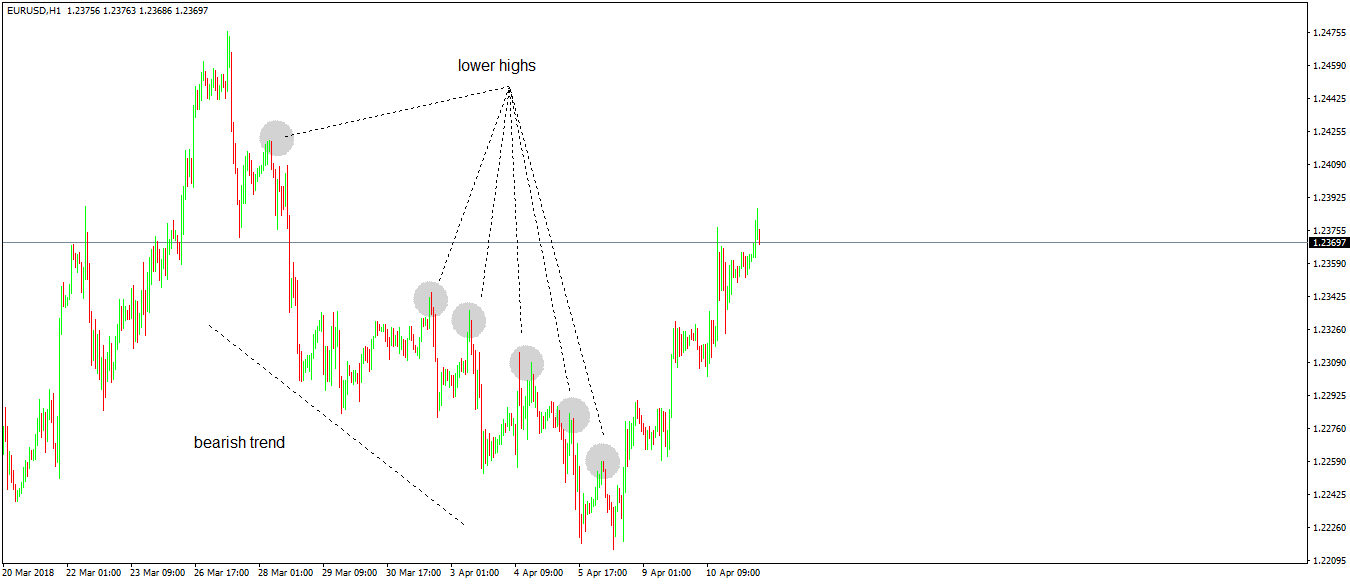
Next, wait for the market to break the series, in what will become the B-C segment. The short-covering, remember?
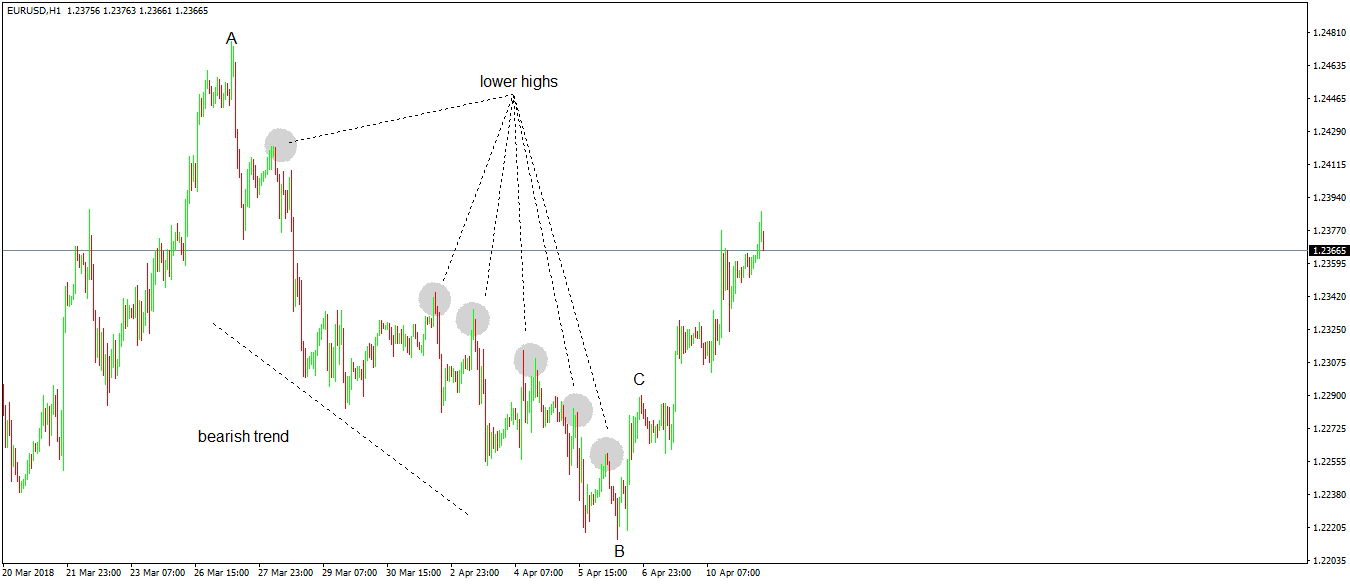
If we use the original Gartley labeling, this EURUSD 2018 chart looks would be labeled as below:
The A-B and B-C segments present, traders focus on the pullback that typically comes between 31.8%-50% of the B-C segment. In this case, it barely came into 31.8%, but it did.
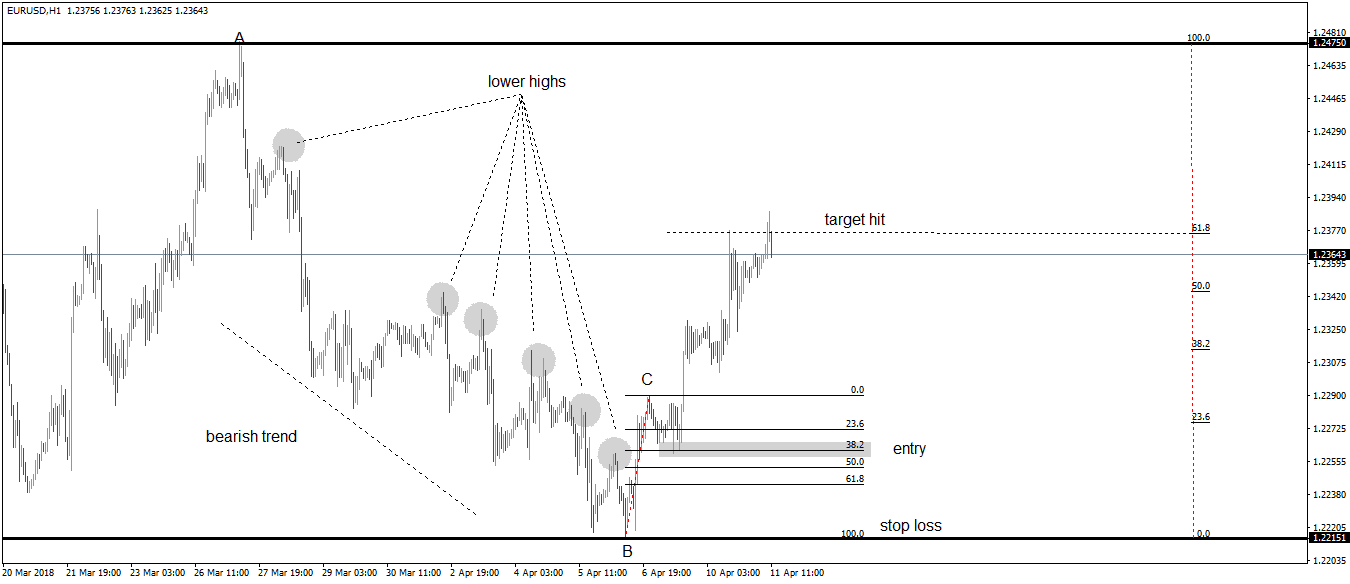
According to the original Gartley setup, to go long in this Forex trading scenario, the entry comes on the pullback. Sometimes the withdrawal is much stronger, reaching values beyond 50% or even 61.8%, but that doesn’t invalidate the stop loss: the end of the A-B segment.
Finally, let’s set up the take profit. For this, we use the Fibonacci retracement tool, measure the entire A-B length, and find out the take profit.
The risk-reward setup, in this case, doesn’t reach the 1:3 level, but a little over 1:2. However, it is enough for a sound trade with clear money management rules.
Conclusion
Just because a concept or trading theory is old, it doesn’t mean it won’t work in the current financial markets. I doubt Gartley or Elliott knew what the future would hold, or how online trading would shape the way the markets function in 2018.
Yet as shown above, the original setup considers basic greed and fear, short covering and trending conditions, which are things that still happen in any market today.
The original Gartley pattern is the base for harmonics trading as most of the retail traders involved in Forex trading today already know. In the 1970’s, Larry Pesavento took the Gartley’s original work to a new dimension, introducing the so-called “Gartley 222” method.
Further in time, Scott Carney took Pesavento’s approach to make the Gartley even more exact, introducing many more Fibonacci ratios and money management rules.
However, it is hard to tell which approach is closer to perfection. I don’t see a need to choose between the three, I would say the later ones just offer some variations to the original concept, as they are all derived from the Gartley’s original work.
The patterns that are known in today’s Forex trading, like butterflies, bats, crabs, and so on, are nothing but an attempt to put the original Gartley approach into automated trading. Unfortunately, programmers forgot or didn’t know the simple rules in the Gartley’s original work.
Hopefully this article helps to revive the need for simple patterns in technical analysis. Simple things work best, even in Forex trading.