

Introducing Ichimoku: Elements and How to Trade with It
The Japanese approach to technical analysis took the Western world by surprise. Suddenly, the technical analysis found a new way to address charts.
The Western approach to trading, while efficient, lacks the rules and rigor the of the Japanese style. When discovered that the Japanese patterns exist for more than a couple of hundred years, technical traders wanted to know what’s so unique about this approach.
It is no wonder they were quickly embraced, together with the candlesticks charts. Today, candlesticks are part of any Forex trading analysis, with the more significant timeframes patterns being watched by traders all over the world.
Because of their immense popularity and success in the Western world, traders started to look at different Japanese methods and trading tools, to see if there’s something of similar value at least.
Their searches paid. The Ichimoku Sanjin (a pseudonym), developed an indicator called Ichimoku Kinko Hyo, that shows the entire state of a market.
While developed to trade on the Nikkei index, the Ichimoku indicator quickly became famous due to its robust trading system. Known also as the Ichimoku cloud, it incorporates past, present and future prices in a trading analysis.
Introducing the Kumo
Today, the indicator is an integer part of all trading platforms. Either professional ones destined to the retail trader, they all show the Ichimoku as a special indicator.
Some categorize it as a trend indicator as the MT4 platform does. Others, as an oscillator.
As always, where there’s ambiguity, the truth sits in the middle. In fact, the Ichimoku indicator is two in one: both an oscillator and a trend indicator.
The Ichimoku Kinko Hyo stands for “the market in equilibrium”. Effectively, its elements show an equilibrium between past, present and future prices.
The MT4 platform offers it under the trend indicators, and before applying it on a chart, one can see the default settings of 9, 26 and 52 for three of the indicators elements.
Before explaining why let just mention that the Ichimoku has five lines:
- Tenkan
- Kinjun
- Chinkou
- Senkou A
- Senkou B
They are nothing but some sort of classic moving averages that were known in the Western world. The difference is that they average not the closing price of previous candles, but the higher highs and lower lows made.
Applied to a chart, it looks like this:
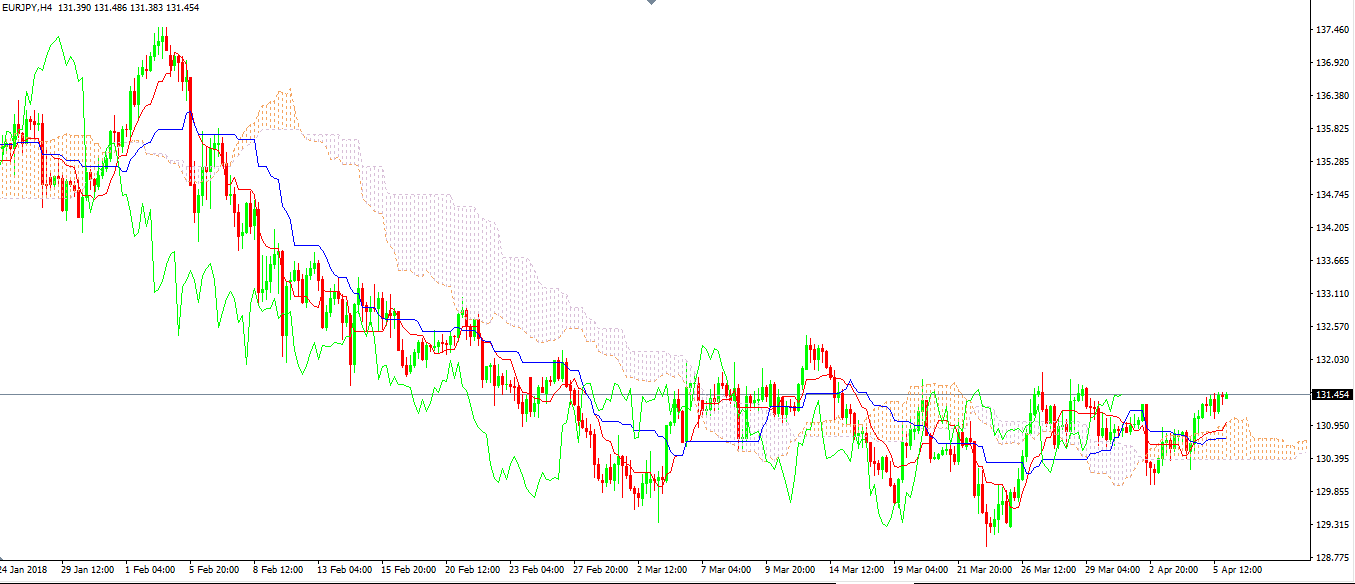
This is the EURJPY four-hour timeframe, showing the cross pair in a bearish trend lately. From left to right on the bearish trend, the five elements that make the Ichimoku indicator are:
- Chinkou – the green line
- Tenkan – the red line
- Kinjun – the blue line
- Senkou A – the lower part of the cloud
- Senkou B – the upper part of the cloud
As you already noticed, the cloud (a.k.a. Kumo), is the distance between the Senkou A and Senkou B lines. When Senkou A crosses below the Senkou B, the cloud is bearish, indicating potential downside.
When Senkou A moves above Senkou B, the cloud turns bullish. Traders want to go long.
To fully understand the stance of equilibrium, we must start from the current prices. As such:
- Tenkan and Kinjun refer to current prices
- Chinkou to past prices
- The Kumo to future prices
It is the one and only indicator to project the cloud 26 periods ahead of the current price. And, the Chinkou 26 periods before the actual price. Hence, the current price is in a stance of equilibrium.
Even when trending, the equilibrium exists, as the distance remains the same.
Forex Trading with the Kumo
The first way to trade with the Ichimoku indicator is to use the cloud as support and resistance. Because the indicator projects the cloud forward in time, we already know the possible support or resistance.
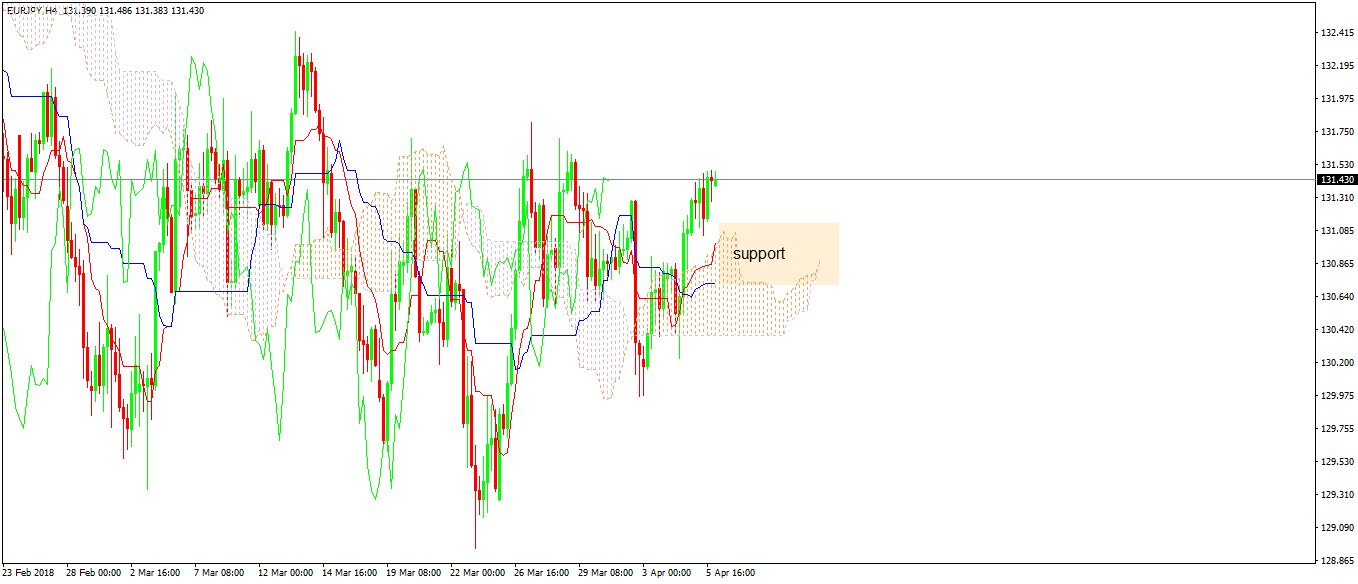
The same EURJPY chart shows the cloud acting like support on any dip now. Keep in mind that with every candle that closes, the cloud will keep moving on the right side, projecting future support levels.
Strong trends don’t see the price coming too often to touch the cloud. If the price manages to touch the cloud more than once, that’s a sign the trend will reverse, or at least it’ll pause before taking a break.
Another way with good results in Forex trading is to use the cloud’s turning point. As you can see, the cloud changes the color, from bullish to bearish and the other way around.
It happens when the two Senkou lines cross above or below each other. The crosses represent a change in market conditions and are great places to trade.
The key is to keep in mind that when the cross appears on the chart, the actual price is twenty-six periods ahead of it. Even so, all the crosses from above, in a ranging market, offered great trades on the short to very-short-term perspective.
In stronger trends, even better. The AUDUSD rising trend at the end of 2017 and start of this year, shows us other great entries.
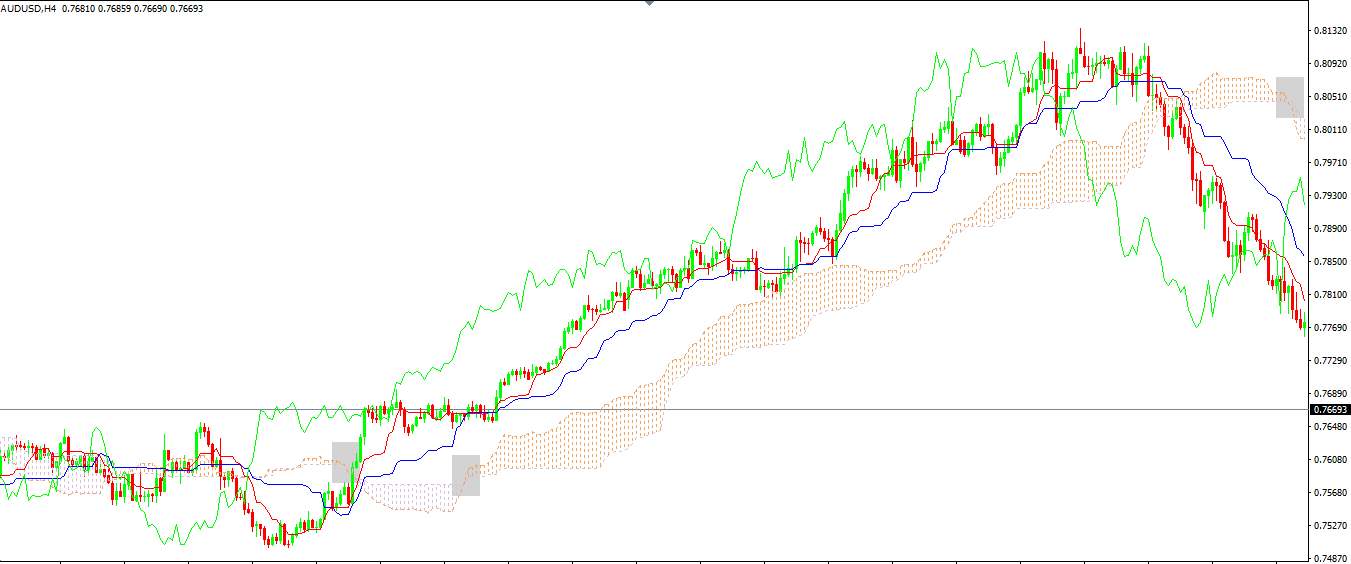
In Forex trading, every trade must have an entry, stop loss and take profit. In this case, use the previous swing low or high as a stop loss, and quickly trail the stop to book profits as early as possible.
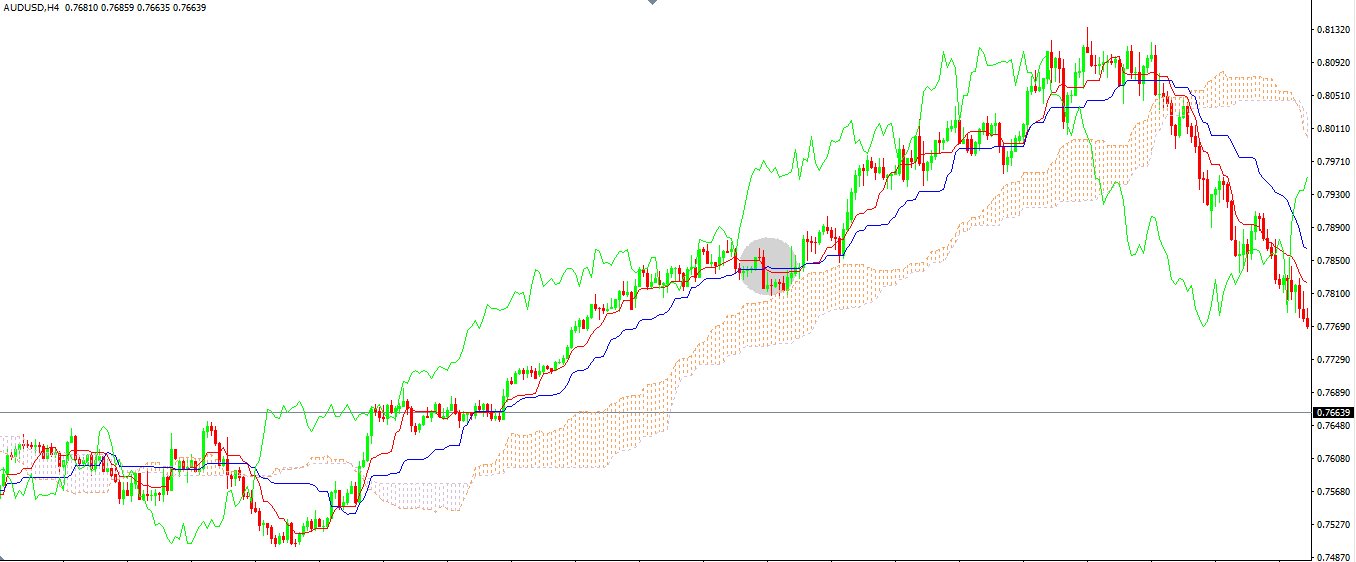
Forex Trading with the Tenkan/Kinjun Cross
The Tenkan and Kinjun resemble two moving averages: one faster than the other. In strong bullish trends like the one above, the Tenkan will always stay above the Kinjun line.
Moreover, the cloud is bullish. As long as the order persists, it is no point in shorting the pair. The earliest sign that something is wrong with the trend is when the Tenkan line crosses below Kinjun.
In the AUDUSD example, it happened here:
But, if this article so far is of any good, we learned that we should ignore that bearish Tenkan/Kinjun cross. Why?
It is the first time when the price touches the cloud. In any bullish trend, the cloud acts as support, and that’s a great place to go long, not short.
Proving the theory right, the AUDUSD pair bounces as the bullish trend resumes. However, it comes to test the cloud for the second time.
In doing that, it shows the trend weakens, and the Tenkan/Kinjun lines cross too. That’s a bearish sign, and traders go short with a stop loss at the highs and using a proper risk-reward ratio.
Conclusion
One of the most popular indicators in the retail trading world, the Ichimoku Kinko Hyo system has something for everyone. Trend lovers find it great for buying dips or selling spikes when the price first reaches the kumo or the cloud.
Contrarians check for the cloud to change before going long or short and fading the underlying trend. The same with the ones that use the Tenkan/Kinjun cross.
Those that paid attention until this point in the article may have noticed the Chinkou misses from all examples. It is with the intention that it remained out of any analysis.
Later in the Trading Academy, there will be an entire article dedicated to the importance of Chinkou and how to use past prices to project future levels.
To sum up, the Ichimoku is one of the complete indicators in technical analysis. It is used in other financial markets, not only in Forex trading, as everyone wants to ride a trend or to spot a reversal.