

Overbought and Oversold Levels: Myth or Reality
A trading platform offers trend indicators and an oscillator for the retail trader to use. As a rule of thumb, any indicator that appears on the main chart is a trend indicator. It follows the trend and helps traders buying dips or selling spikes.
Besides trend indicators, technical traders use oscillators. The need for an oscillator came to exist because of traders continually trying to pick tops or bottoms.
Even during the most robust trend, one can imagine, people are doubting the move for various reasons. For example, take the last year’s EURUSD rally.
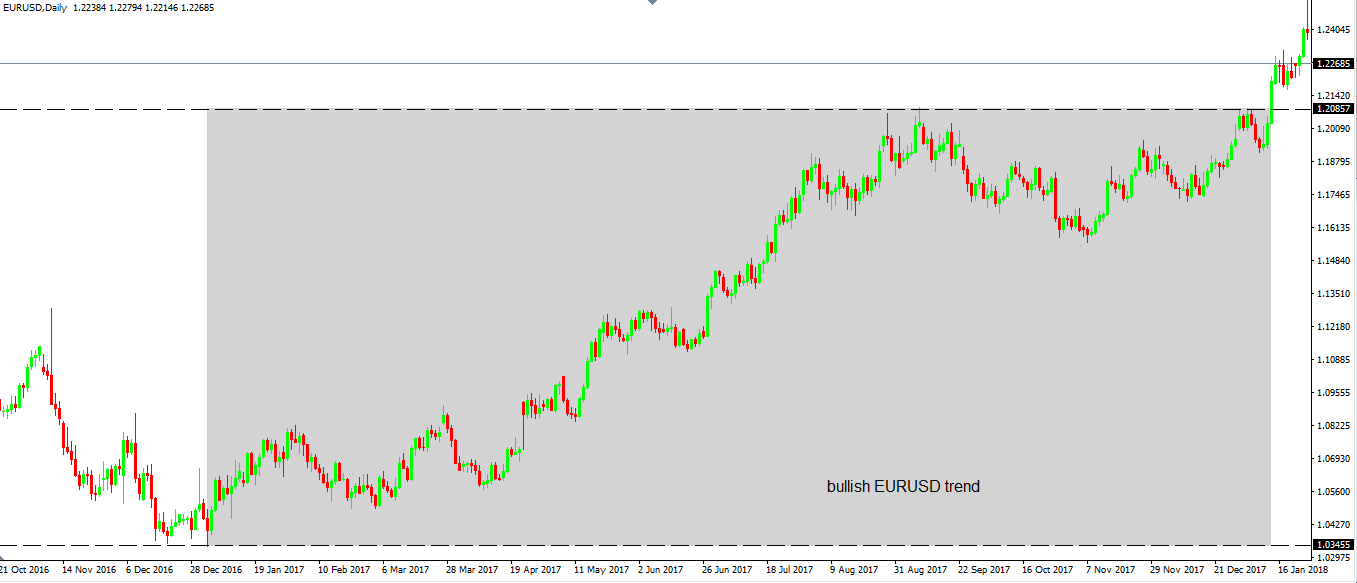
The pair rallied for the entire year, starting with January and ending at the highs in December. Yet, during the massive rally (a move from 1.05 to 1.20), the comments against Euro were mostly negative.
Starting with the ECB, everyone talked the Euro to the downside, for various reasons:
- The deficit in Southern countries is high
- Euro doesn’t stand a chance on the long run as no monetary union has survived
- Fed will hike rates even more and the ECB won’t. Hence, the interest rate differential will push the Euro down
- Inflation in the Eurozone is still very weak, etc.
It is easy to have a reason to fade a trade and a good exercise. But fighting with a chart is no good for the trading account.
As such, retail traders either stick with the main direction (retail trading size in the overall Forex market is very small) or avoid the pair. This is an expensive place to find out and to test your account on a questionable premises.
Technical traders created oscillators because they wanted to spot fake moves that the market makes. As such, any oscillator (and trend indicator too) considers multiple periods before plotting a value.
Moreover, traders use various strategies to trade oscillators. One of the most popular ones is based on the fact that an oscillator shows overbought and oversold levels.
Hence, the easiest money to pick is to sell in the overbought territory or to buy in the oversold. What can go wrong?
Everything. In Forex trading, everyone knows this approach.
But, almost all retail traders lose their first deposit. Something must be wrong, right?
Overbought and Oversold Forex Trading with the RSI
The RSI stands for the Relative Strength Index, and we explained how Forex trading works with it, both from an overbought and oversold perspective and from a divergence point of view.
As a reminder, when the market is in a range, the overbought and oversold approach works just fine. When trending, that’s a losing approach. Even divergences fail in super-strong trends.
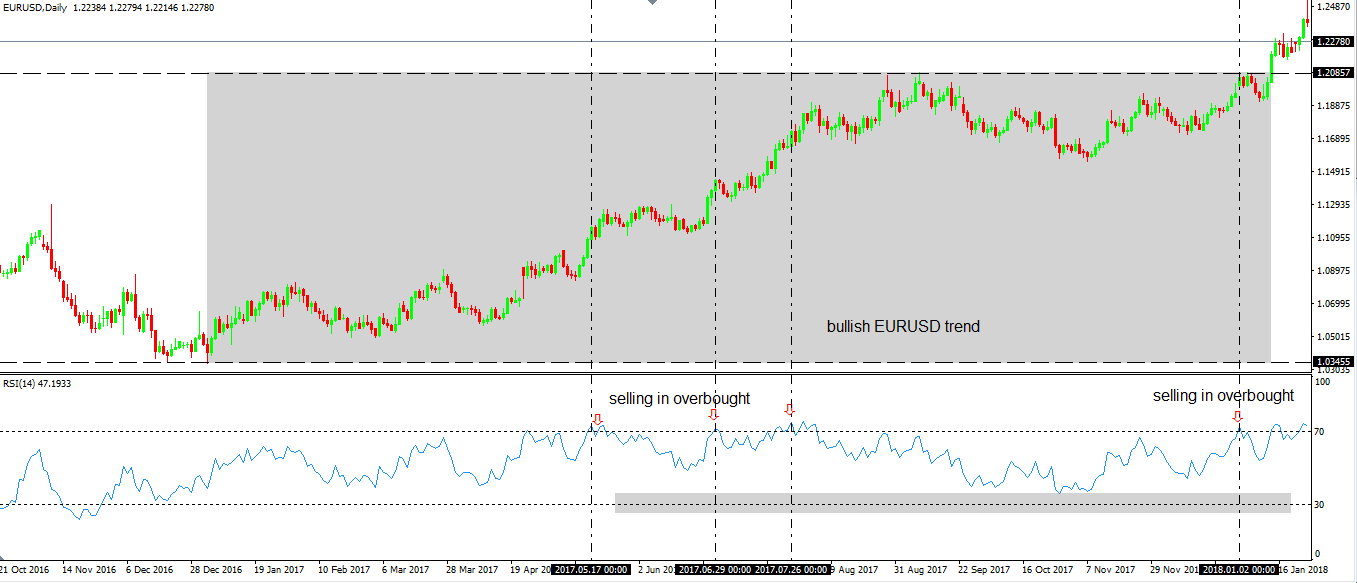
The reason the EURUSD bullish trend appeared above is to see if we can draw some conclusions from it and use them in other similar trends. Let’s see how selling in overbought territory worked for the EURUSD pair during that great bull run!
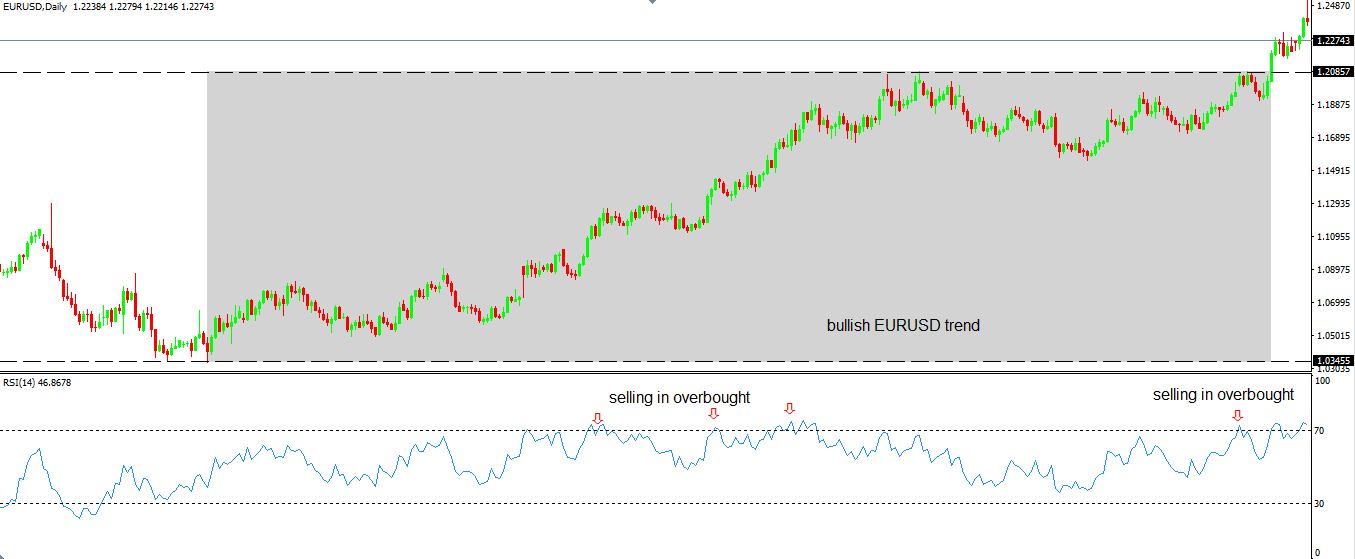
For four consecutive trades, selling in the overbought territory proved catastrophic. Here’s a better perspective:
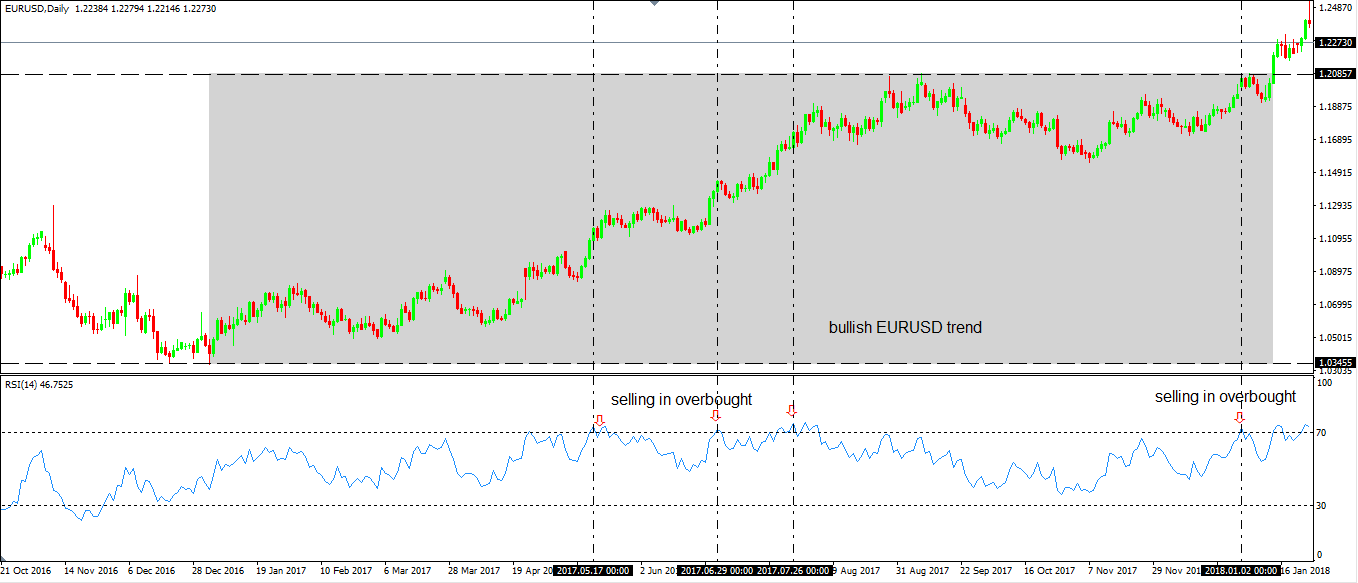
What can we say about selling in the overbought territory? One thing is for sure: it doesn’t work in this case. Hence, we proved that in trending markets, selling in overbought or buying in the oversold territory is just a myth. Not a Forex trading reality.
Below is the AUDUSD four-hour timeframe. The pair travels in a strong bullish trend and offers even more occasions to sell in overbought territory.
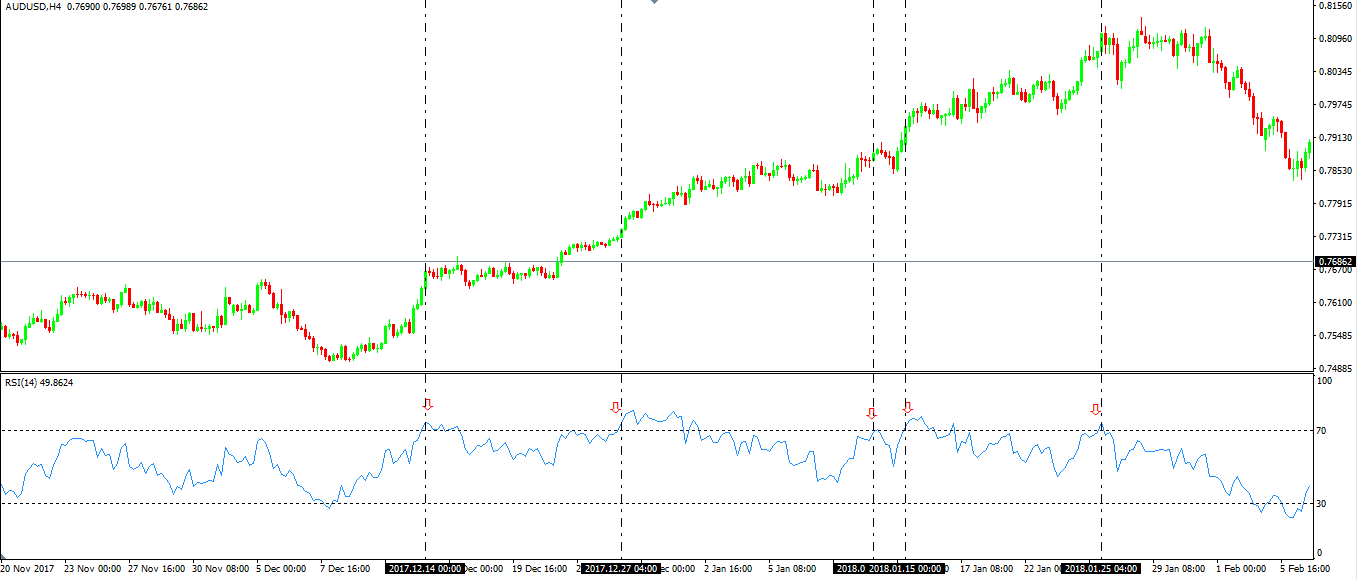
However, all bearish signals proved to be fake. How about doing the opposite? After all, if everyone knows the selling approach, but are still lose money, how about doing the opposite? How about buying in overbought? In both cases presented so far, that would be a great decision. But how do we know how to define the strong trend?
Rules help. The key is to check for things or patterns that formed in both cases and establish rules for trading future similar patterns.
We notice that both in the EURUSD and the AUDUSD cases, the RSI failed to break below the 30 anymore. For as long as the bull run held, the RSI didn’t reach the oversold.
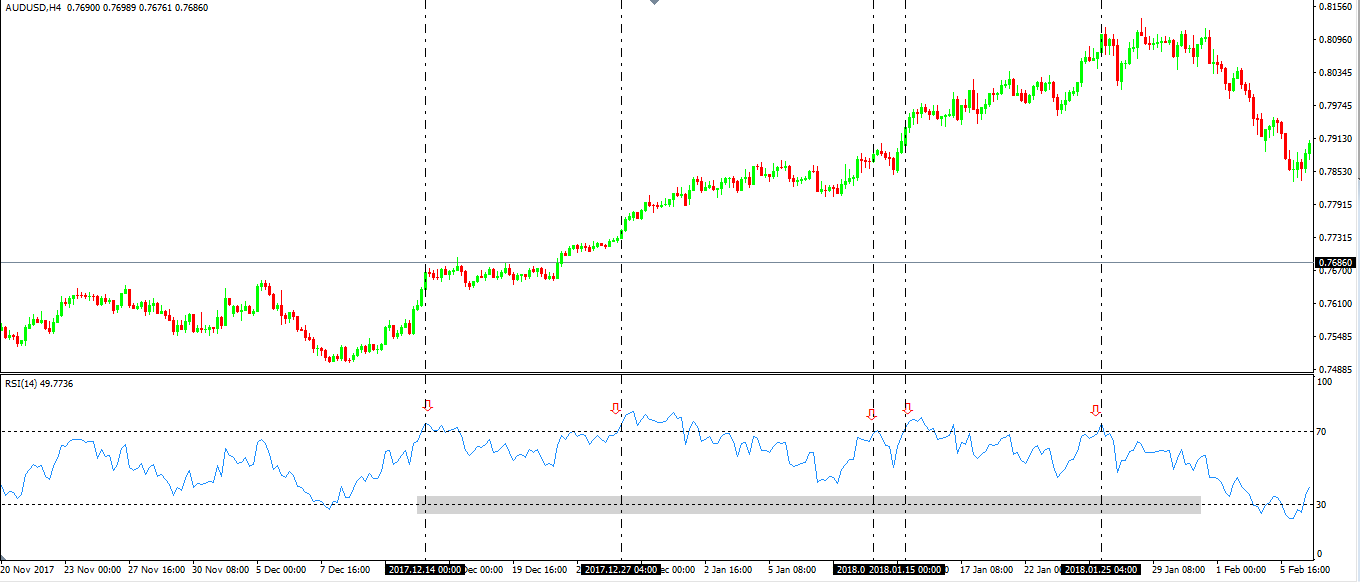
Therefore, the selling transforms into buying, as long as the oversold territory doesn’t come. From the moment the RSI dips below the 30 level, the strategy loses its effectiveness. It signals a weakening trend.
Using Other Oscillators in Forex Trading
As a rule of thumb, all oscillators more or less show the same thing: how to pick an early entry into a trade. Or, how to spot a reversal as early as possible. Traders want to be ahead of the crowd and will do anything to gain the slightest competitive advantage.
Think of other oscillators popular among Forex traders:
- Stochastics. Two lines showing overbought and oversold territory above 80 and below 20. Traders buy when the fast stochastics crosses above the slow one in oversold territory. And, they do the opposite in overbought. They sell. Does it work? No. As an individual strategy, it fails more than it works.
- DeMarker. Similar to RSI, it shows overbought and oversold conditions above 70 and below 30. Does it work in the classic interpretation? No. It fails more than it works.
- -CCI. The Commodity Channel Index is famous for its quick turns. It traveled both in the positive and negative territory, with overbought values above 100 and oversold behind -100. I’ll let you check the chart below and draw your own conclusion if the standard approach works or not.
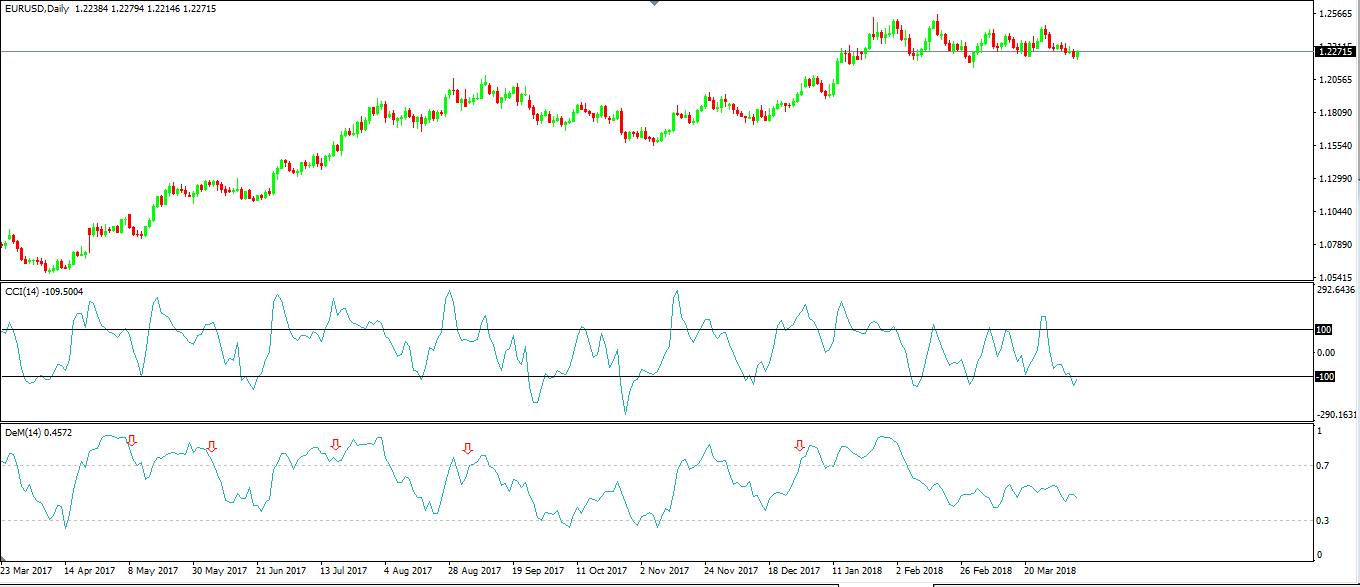
The DeMarker oscillator appears at the bottom of the table, applied on the same EURUSD daily chart. The arrows signaling the short side belong to the classic interpretation for overbought and oversold levels. No further comments needed!
However, if we apply the same strategy as in the RSI case, like doing the opposite, why not buy, instead of selling? After all, what if we stand a better chance?
Conclusion
Don’t be afraid to try new things. This is the way humankind progressed, and the way technical analysis evolved too.
Think differently. Try something new, then see if it works in most cases.
The holy grail in Forex trading hasn’t appeared yet. If someone lets you believe so, think twice.
Instead, a decent strategy that wins more than fails may turn out profitable using proper money management rules. One thing is sure: if everyone knows how to use an indicator, and yet most of them fail, that approach has a big question mark. Right?
Technical analysis is full of such statements. But, no one considers that the markets change in time, and old strategies may not work anymore.
Some traders have a short-sided view when they test a strategy. For example, they back-test some conditions for the past six months on one currency pair.
Then, for a whole year. Or two, or more!
As a conclusion, the strategy won’t fail. They’ll buy any drawdown because history tells them to do so. Oh, but that’s so wrong on so many levels.
How about if the market consolidated or kept the same conditions in place for the whole time frame of the back-testing? And then, suddenly, when the balance broke, the system doesn’t work.
The conclusion is that no system works forever. There’s a fine line between the risk and reward, and every trader has a different approach to trading. Patience and discipline are as important as any trading strategy.
All these things matter for the overall profitability when trading for a living. If someone tells you how to use a strategy, theory, indicator, etc., don’t take it for granted. Check it, adapt it, test it, apply money management rules to it, and then give it a shot.
That’s Forex trading. That’s all it is.