

How to Ride the Perfect Trend
One of the first things we encounter in Forex trading is the notion of a trend. Conventional wisdom says that traders always look to ride the perfect trend.
But what makes a trend anyway? And, moreover, what makes it perfect?
Let’s be honest here: everyone wants to ride a trend with little or no pullbacks. A trend that doesn’t give traders emotions, whether the market will turn or not.
As such, we can say that the perfect trend:
- Lasts forever
- Has no pullbacks
- Profits come easy
Is this real, though? Of course not.
However, it doesn’t mean that the Forex market doesn’t trend. In fact, some of the stronger trends in Forex trading have beautiful sequences not seen in other markets.
The problem comes from numbers. Or, statistics.
Over sixty-five percent of the time, the markets (e.g., currency pairs) stay in a consolidation. It makes it difficult to ride a trend when…trends don’t exist. Right?
Well, it depends. Mostly, it depends on the timeframe.
Defining a Trend
“The trend is Your Friend,” goes the saying. Everyone in forex trading knows that, but few understand the concept.
A trend is either:
- Bullish (rising trend, the market moves to the upside, traders go long and look to add to a position on every dip).
- Or bearish (falling market, it moves to the downside, traders go short and look to add to a position on every spike).
Nothing in between fits the definition of a trend. Consolidation means ranging conditions formed, and the reason for staying in the trend disappears.
Unless we talk about different time frames. Let’s use the current EURUSD price action for a change.
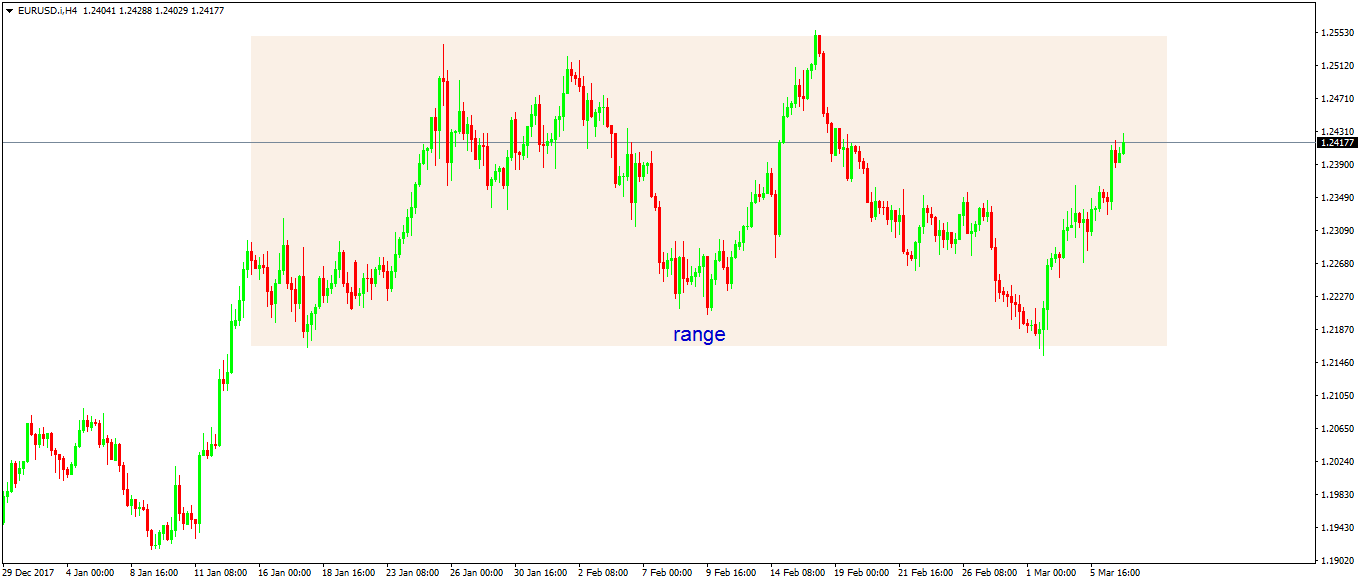
The 4h chart (four-hour chart, meaning each red and green candle represents a four-hour interval) above shows the pair sitting in about a three hundred pips range. Since the middle of January, the EURUSD can’t break higher, nor lower.
Put simply, the market consolidates. It waits for a reason to move. Hence, no trend is present.
But a closer look at a different time frame reveals trending conditions. First, let’s go on a lower one: the hourly chart.
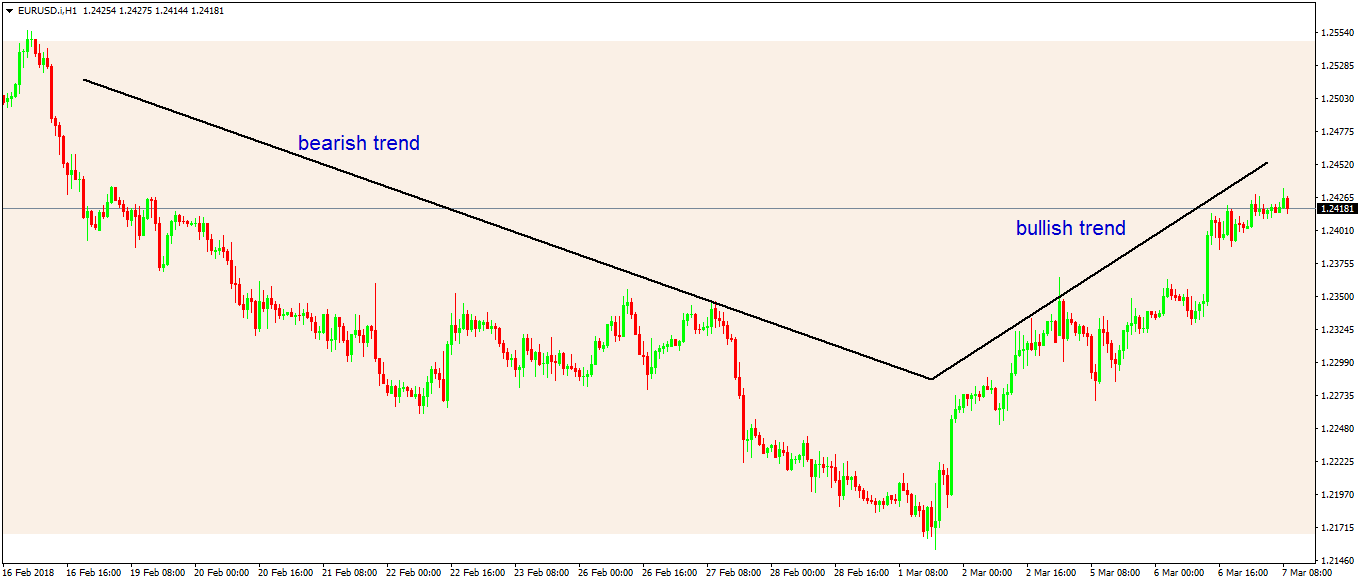
It shows both a bearish and a bullish trend. The only difference between the two charts is the time frame.
How about a bigger time frame? Let’s have a look at the daily chart.
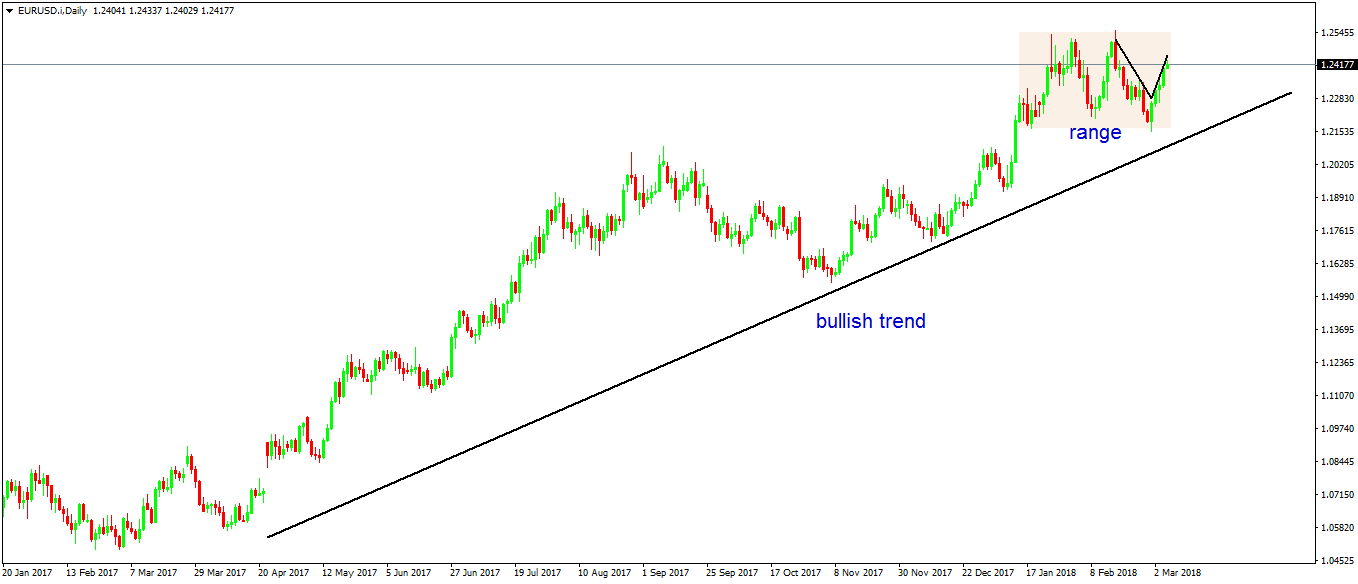
As you can see, the daily EURUSD is in a massive bullish trend that started in the spring of 2017. The current range that we analyzed on the four-hour time frame is nothing but a range or a consolidation.
The idea of these time frames was to explain how a trend forms. And, how traders perceive a trend.
It depends a lot on the time perspective. And, on the trading style.
Scalpers (traders that take multiple trades per day and don’t keep open positions overnight) will find it difficult to ride a trend on a time frame bigger than the hourly. For them, quick profits or quick moves matter the most.
Swing traders and investors (traders that usually have a more significant time horizon in mind for their take profit levels) don’t even bother looking at such a time frame. They’ll look at the opportunities on the bigger picture, and ride a trend there if any.
The Importance of Higher Lows and Lower Highs in Forex Trading
Bullish and bearish trends, therefore, appear on all time frames. While the market might consolidate on the daily chart, on the hourly or five-minute charts, small trends emerge.
Some of them take a few days, some a few hours, but there’s an opportunity to make a profit. And, where there’s opportunity, traders have a strategy.
What makes a trend, though? The answer comes from the sequence in the price action, also called the higher lows and lower highs sequence.
In other words, in a bullish trend (upward trend, traders want to go long, or buy):
- The market forms a series of higher lows. If the price is not able to break the series, the trend remains in place. Hence, traders will buy dips, to add to the current position or to find a good entry to join the ride.
The opposite forms in a bearish trend.
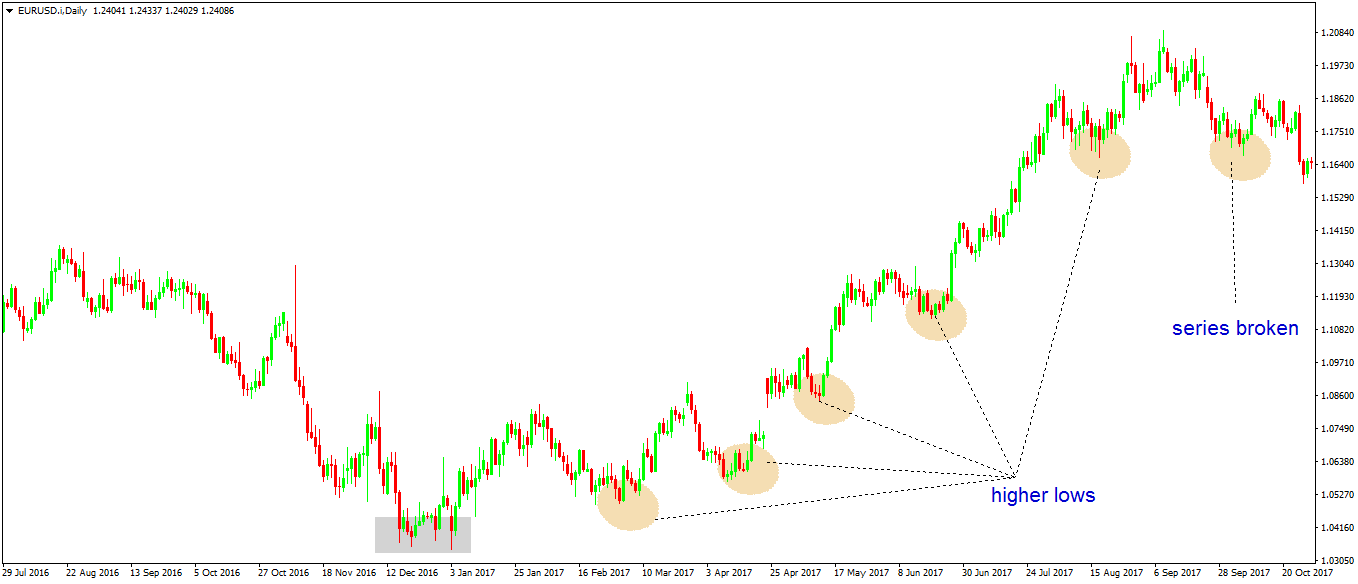
The chart above illustrates a bullish trend. Traders’ task is to find the series of higher lows, to correctly interpret it, and to ride the trend.
Sometimes, like it is the case above, Forex trading needs confirmation. How do we know that the previous trend ended?
That’s simple: we look for the market to invalidate the conditions of a bearish trend. More precisely, for the series of lower highs to break.
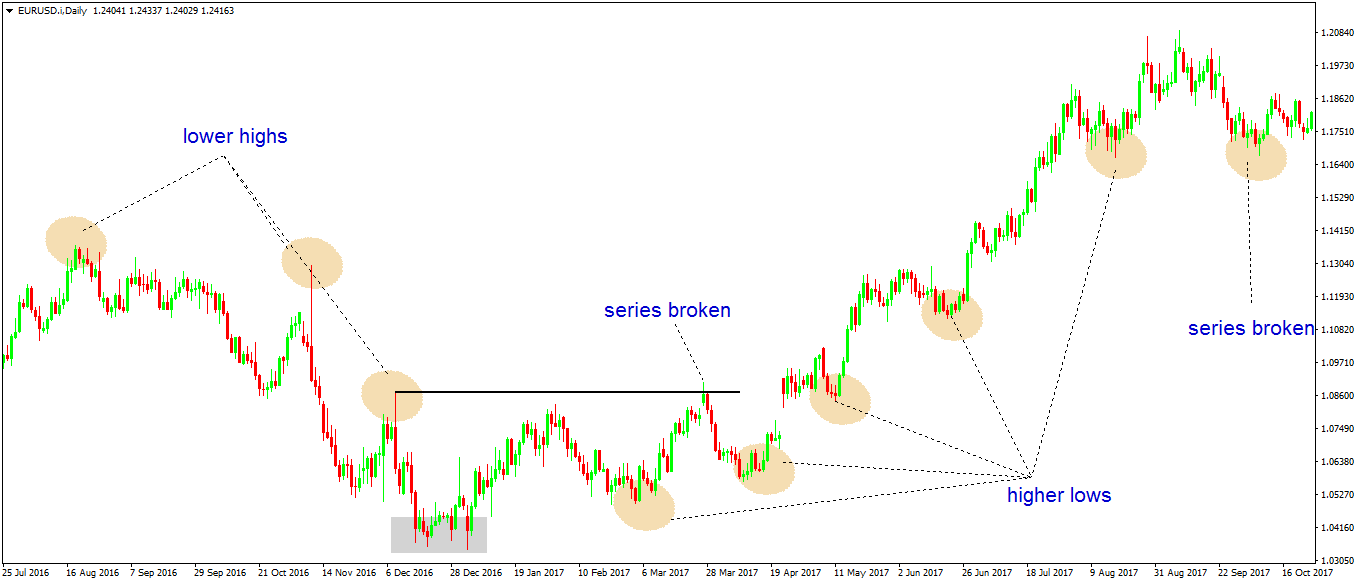
The previous bearish trend’s series of lower highs was broken, signaling a bottom might be in place. Next, traders check if a new trend, a bullish one, started, buy identifying a series of higher lows.
If that’s the case, the new direction becomes obvious. Of course, in a bearish reversal, traders wait for the higher lows series to break, and then check for the presence of a lower highs one.
Trendlines in Forex Trading
A trendline, or the line of a trend, needs only two points. Connecting two points (typically two higher lows or lower highs) gives the trend line.
The difference between the series explained earlier, and a trend line is that the last one is more visible. Traders effectively see if the price stays below or above it, and act accordingly.
However, using a trend line becomes tricky at some point. Therefore, the series of lower highs and higher lows is more relevant to ride a trend, then a simple trend line.
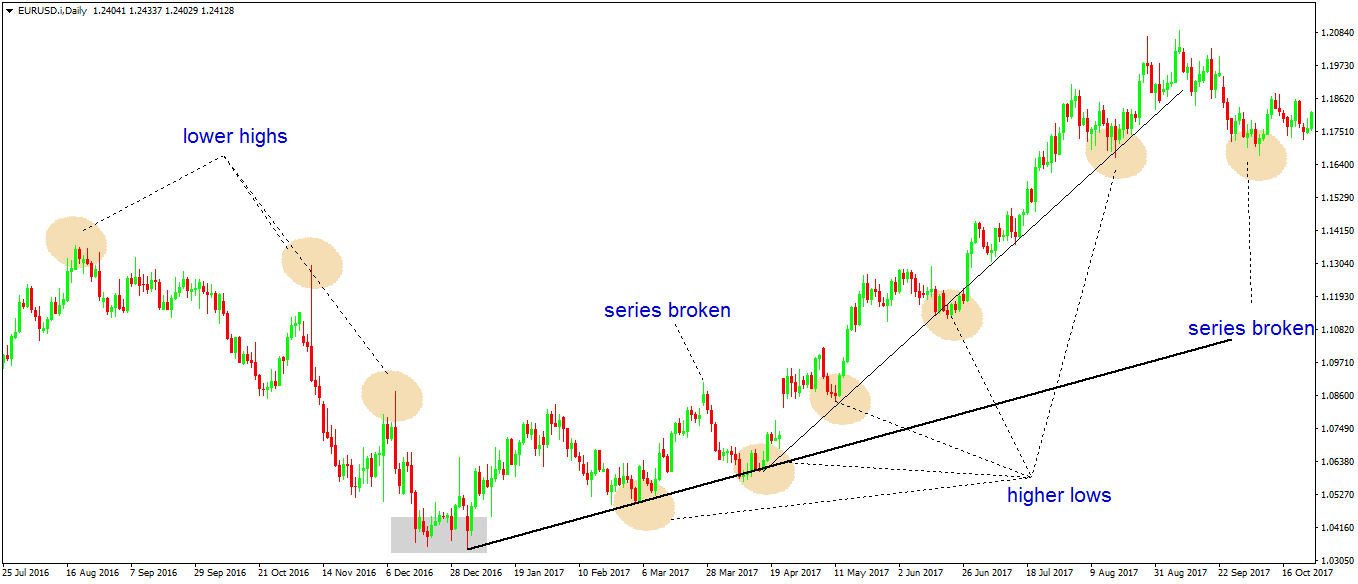
The EURUSD chart above shows two trendlines that come to help. The thicker black one connects the bottom to the first higher low.
The problem with it comes from the fact that the next higher low point breaks it. As such, many traders will exit the long side, only to find out it was a fake break and to watch the market exploding higher.
In fact, the problem came from the trendline, not from the higher low series. The series principle as discussed in this article functioned and traders that followed it enjoyed the bullish ride.
But the chart above has another trendline. The trend becomes more aggressive, stepping away from the primary trendline.
Traders that strictly use the trendline principle will make the same error. After the first two higher lows, the third one breaks the trendline. Again, it was a fake move, as the trend resumed with a vengeance.
Conclusion
The article’s title may mislead you, as the perfect trend doesn’t exist. There’s no way the market forms perfect trending conditions.
Yet, if it does, traders will work very hard to find reasons and arguments to trade in the opposite direction. Do you think no one shorted the EURUSD pair in 2017 when the bullish trends shown here was in place?
Fundamental analysis and macroeconomics play an essential role. The time horizon for your investment, too.
Some people trade changes in the fundamental picture. They look at macroeconomic trends, like a series of economic data and wait for the economy to break it.
When the set of data analyzed points to the other direction, a new fundamental or macroeconomic trend starts. That’s as good as technical lower highs and higher lows series to define a trend.
But the risk with a fundamental approach comes from central banking. Sometimes, they are slow to react, and traders (typically long-term investment vehicles) end up entering a trade way too early.
All in all, a trend is a trader’s friend and leads to tremendous profits. However, that’s true only if traders know how to ride one.