Candlesticks
by Andrew McGuinness sie 17, 2019
A brief history of candlestick charts
Candlestick charts, as a form of technical analysis tool, were developed in Japan in the 1700s. That is why this charting technique is also known as Japanese Candlesticks.
Before technical analysis was developed, medieval Japan was a place of constant war between the local feudal lords. Because of that, military terminology found its way into candlestick charting with names such as advancing three soldiers pattern, or a gravestone. But once the country was unified in the 1600s, trade and commerce started to spread throughout the islands, and the economy expanded. Soon after, a national marketplace replaced the local markets.
During the economic expansion of Japan in the 1600s, at one point, no currency standard existed, so rice became a medium of exchange. Also, taxes to the feudal lords were paid in rice. The largest and most important rice exchange was the Dojima Rice Exchange in Osaka, which was set during the 1600s. It traded in actual rice until 1710 when the exchange started to accept rice warehouse receipts, called rice coupons. These were in fact the first futures contracts ever traded. All this led to the development of technical analysis and the candlestick charts. The most famous man to use candlestick charts at the time was Munehisa Homma, who amassed a fortune by trading rice futures on the Japanese exchanges.
Until the 1990s, Japanese candlestick charting techniques were practically unknown to the Western world. Steve Nison, who was a technical analyst at Merrill Lynch in New York at the time, is the man who discovered this techniques from a Japanese broker, and then spread the knowledge in the West. Since then, candlestick charts have grown in popularity, so that today they are the charting standard for almost every trader in the stock, futures, options, cryptocurrency, and forex markets.
What is a candlestick chart?
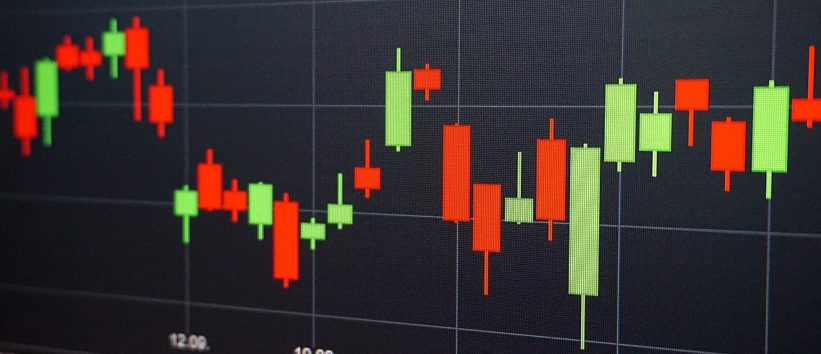
A candlestick chart is a financial chart that portrays the high, the low, the opening, and the closing prices of a particular security, and it is used to describe the security’s movement. Candle charts use the same data as the Western bar charts. The only difference is that the candlestick charts are visually more pleasant and stimulating and make patterns easier to spot.
Candlesticks have two parts: the real body and the shadows. The body of the candle is the rectangular part in between two vertical shadows. It shows the range between the session’s opening price and closing price. When the body is green, or white (these are the default colors in most charting software), the candle is called a bullish candle and the opening price is always lower than the closing price. When the body is red, or black, the candle is called a bearish candle and the opening price is always higher than the closing price.
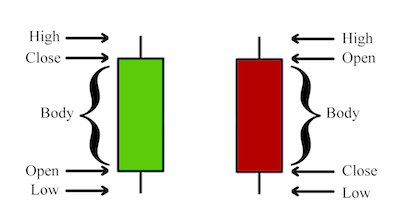
The vertical lines above and below the body are called upper shadows and lower shadows or wicks. These lines represent the session’s highest and lowest price points.
Candlestick charts vs bar charts
Bar charts are a type of financial charts, which use the same data as the candlestick charts. The only difference is that bar charts do not have a body like the candlestick charts.
Before the arrival of candlestick charts, bar charts were the most popular charting style used. However, there are traders who prefer to see the big picture and not the individual patterns, and they usually opt for bar charts, which are simplistic and do not distract the trader. These traders still use bar charts even today.
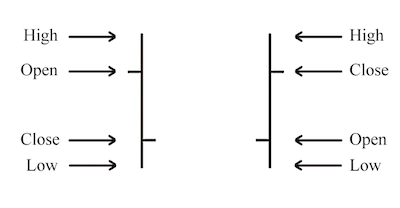
Bar charts are often referred to as OHLC (Open, High, Low, Close) charts.
What is a doji?
When the session’s open and close prices are the same, the candlestick has no body. This type of candlestick is called a doji. Yet, there is a flexibility to this rule. A candlestick can still be considered a doji if the opening and the closing price are within few ticks between each other.
Doji usually represent indecision in the market. However, most traders use it as a reversal signal, especially if it appears near support or resistance zones.
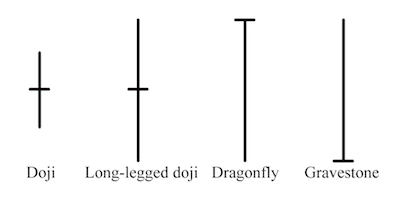
There are four types of doji:
- Neutral doji, when the opening and the closing prices are equal.
- Long-legged doji, when the shadows are longer than usual. This shows clear indecision of the market, which tried to push the price both ways but eventually failed.
- Dragonfly doji, when the opening and the closing price are equal. This happens at the highest point of the price, and it is usually considered a reversal pattern if the position of this candle is in a downtrend. Dragonfly doji shows that the sellers tried to push the price to new lows, but failed to keep it there, and then the price returned near the session’s high.
- Gravestone doji, when the opening and the closing price are equal. This happens at the lowest point of the price, and it is usually considered a reversal pattern if it is found in an uptrend. Gravestone doji shows that the buyers had managed to push the price higher but failed to keep it there, so the price returned to the low price point.
What is a spinning top?
Spinning top is a single candlestick pattern with a small body between longer upper and lower shadows. Its color is not the main attribute, but rather where it appears in the trend. In a strong uptrend, the appearance of a spinning top could signal reversal, and if the color is bearish then the signal is even stronger. In downtrend, the opposite works – the spinning top gives a stronger signal when its color is bullish.
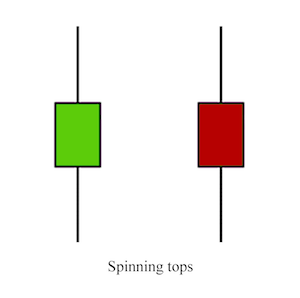
However, when trading on this pattern, it is always best to wait for confirmation of the next candle as this pattern is known to appear in the middle of a trend.
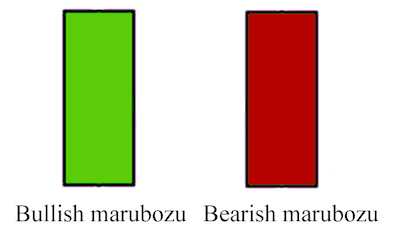
What is a marubozu candle?
When a security has traded strongly in one direction and closed at the high or at the low price of the session, it is called a marubozu candle. Marubozu is the Japanese word for shaved head or bald head, which means that the candle has no shadows on either side, i.e. the shadow has been shaved.
This candle can be a bullish marubozu candle, or a bearish one. The bullish has a long white (or green) body, where the opening price equals the lowest price point of the session, and the closing price equals the highest price point of the session. The bearish marubozu has a long black (or red) body, and the opening price equals the highest price point of the session, and the closing price equals the lowest price point of the session.
Are candlestick shadows significant?
Candlestick shadows show us the trading range beyond the opening and closing price. They can be a great indicator of support and resistance areas. For example, if the price tried to push through a certain zone and failed, it will look like a candlestick shadow on the chart.
Shadows that are exceptionally long are called tails.
Reversal candlestick patterns
Reversal candlestick patterns are technical clues that show us when a shift in market sentiment is about to take place. This does not mean that the trend will end abruptly, which is rarely the case; trend changes are slow. Rather, reversal patterns show us that the trend is likely to change.
There are a number of candlestick patterns that can show us this shift in sentiment. These patterns can be made of: a single candlestick, two candlesticks, three candlesticks, and made of multiple candlestick patterns. The more candlesticks a pattern has, the stronger the signal. However, that also means waiting and missing out on potential profit.
The most common reversal candlestick patterns are:
- Hammer
- Hanging man
- Shooting star
- Inverted hammer
- Engulfing pattern
- Dark cloud cover
- Piercing pattern
- Harami
- Morning star
- Evening star
- Tweezer tops and bottoms
- Three black crows
- Three white soldiers
What is a hammer candlestick pattern?
Hammer candlestick pattern forms when a security is in a downtrend and the last candlestick rallies to close near the opening price or at the highest price point. Usually, this pattern does not have an upper shadow, although it is accepted with a shadow only if it is miniscule compared to the body. This pattern shows that the price at one point had dropped low, but the sellers could not push the price further, thus it rebounded and closed way above the low. This is a bullish reversal pattern.
The candlestick resembles a hammer, hence the name – it hammers the bottom.
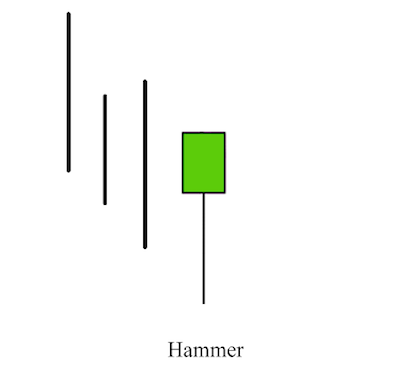
The body can be white or black (green or red), although statistically, the success of this pattern does not rely on color. However, most traders accept that the white has more bullish weight.
What is a hanging man candlestick pattern?
Hanging man candlestick pattern forms when the security closes near the open or at the highest price of the session. Visually, this is exactly the same pattern as the hammer, with only one difference – it appears in an uptrend (the candle is hanging from the top).
This shows that the sellers at one point had the upper hand and pushed the price low, but eventually the buyers managed to recover and return the price to where it opened. In an uptrend, this indecision usually shows that the buyers are losing their grip and a reversal may follow.
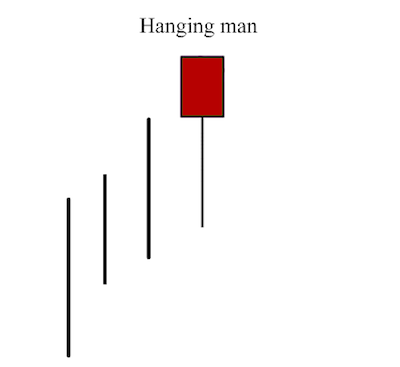
Steve Nison, the man who brought the candlestick charts to the Western world, claims that for this pattern to be successful in predicting the potential reversal, the next candlestick has to open under the hanging man’s body, and preferably to close beneath the hanging man.
Another confirmation is if this pattern appears at the all-time high of the price of the security or at a resistance zone.
What is a shooting star candlestick pattern?
The shooting star pattern is single candlestick pattern that has a small body at the lowest price point of the session, and has a long upper shadow. This means that the buyers tried to push the price to new highs, but they failed to keep it there.
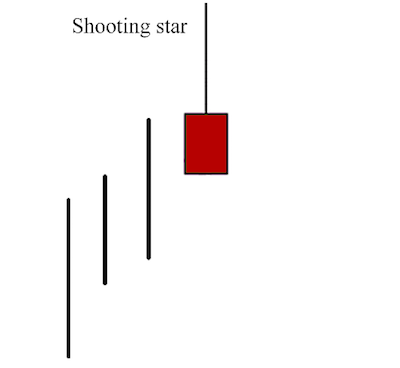
The color of this pattern is not significant, which means it can be both bearish and bullish candle. If this pattern appears in an uptrend, it signalizes a possible top and a trend reversal.
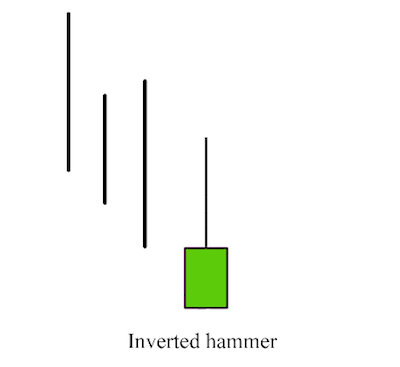
What is an inverted hammer candlestick pattern?
The inverted hammer pattern is a single candlestick pattern with a long upper shadow and small body at the lowest price of the session. This is basically, the shooting star pattern with the only difference – it appears in a downtrend. This is a bullish reversal pattern. As with the shooting star, the color is not important here as well.
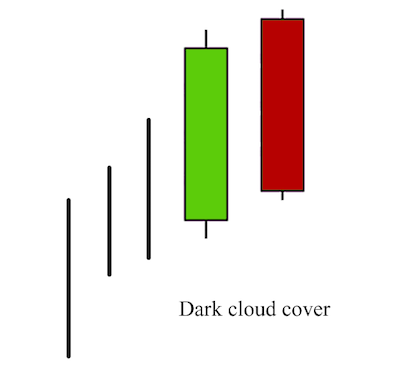
What is a dark cloud cover candlestick pattern?
Dark cloud cover pattern is a two-candlestick pattern that appears during an uptrend. The first candlestick is always bullish, while the second is always a bearish candlestick. The second candle has to open higher than the first candle and then close near the low. The more it pierces the first candle, the stronger the reversal signal. If the second candle does not close below the halfway point of the first, it is usually best to wait for the next candles for confirmation that the trend is indeed at an end.
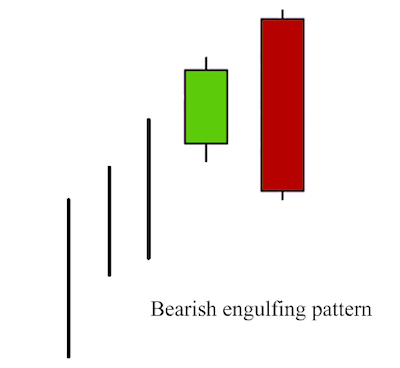
What is engulfing candlestick pattern?
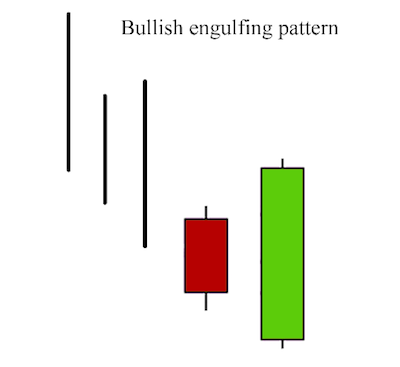
Engulfing pattern is a double candlestick reversal pattern that appears either in an uptrend, called a bearish engulfing pattern, or in a downtrend, called a bullish engulfing pattern.
For the engulfing pattern to work, the market has to be in a clear trend, and the two candles need to have differently-colored bodies. The second candle is always larger than the first, thus it engulfs the first candle.
If this pattern appears in an uptrend, the first candle is the one with a small body, which can sometimes be a doji or a spinning top, while the second candle is a massive one that covers the opening and the closing price of the first. This is the bearish engulfing pattern that signalizes a potential trend reversal. The larger the second candle, the stronger the signal.
In a downtrend, the candles look exactly the same, with the only difference being the color of the two candles. This is the bullish engulfing pattern that shows a potential end of the downtrend.
The engulfing pattern can also serve as an indication of support and resistance zones.
What is a piercing candlestick pattern?
The piercing pattern is a dual-candlestick pattern where the first candle is a long bearish candle, and the second one is a bullish candle that closed higher than halfway of the first. Basically, this is the inverted dark cloud pattern, and in this case, it is a bullish reversal signal that appears in a downtrend. The greater the degree of piercing into the previous candle, the stronger the reversal signal.
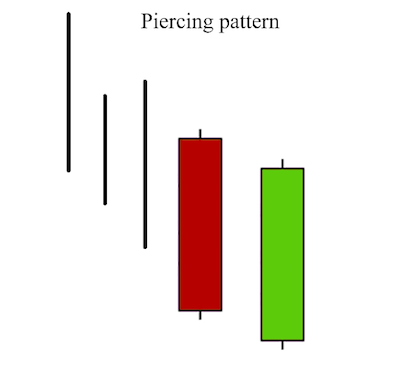
The piercing pattern resembles the bullish engulfing pattern, except it does not entirely cover the previous candle.
What is a harami candlestick pattern?
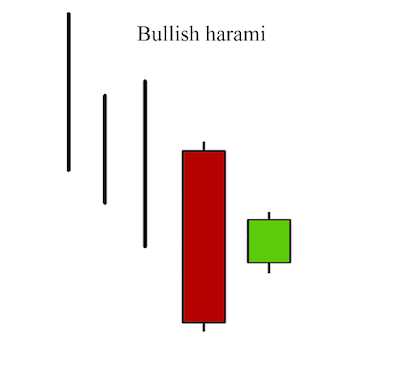
Harami is a two-candlestick pattern that can appear in both downtrend and uptrend, thus it can be a bullish reversal or a bearish reversal pattern. The first candle is always larger than the second, while the second candle is always a spinning top.
The bullish harami pattern appears in a downtrend. In this variant, the first candle is a long bearish candle. Ideally, the second candle should sit near the middle of the first candle’s body.
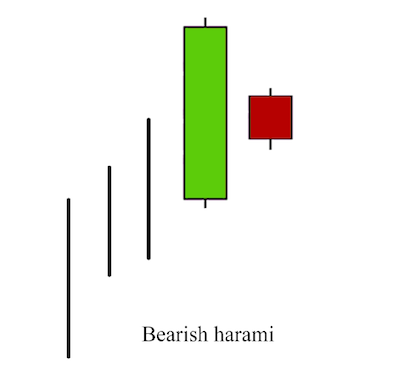
In the bearish harami variant, the first candle is a long bullish candle, whereas the second can be either a bullish or a bearish candle. This pattern always appears in an uptrend and signalizes a shift in sentiment and a possible reversal.
Another variant is the harami cross, where the second candle is a doji instead of a spinning top.
The word harami in Japanese means pregnant and that is how the pattern looks – the first candle is the mother, and the second candle the baby.
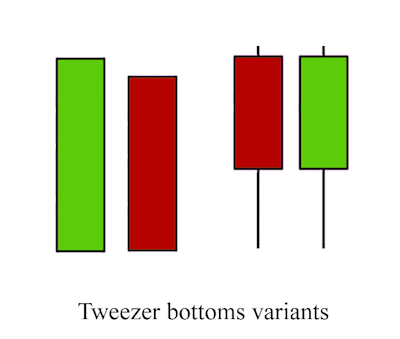
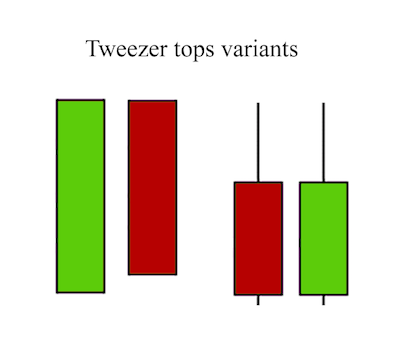
Tweezer tops and bottoms
While the major identification point for most candlestick patterns is the body of the candles, with tweezer tops and bottoms, the major point is their shadows.
The tweezer top pattern is made of two candles when their consecutive highs match; the tweezer bottom is made of two candles when their consecutive lows match. Ideally, the first candle should be long, while the second should be smaller. Each of these candles can be composed of bodies, shadows, or doji, and still be considered a tweezer pattern.
The tweezer pattern is used to identify a top or a bottom in a trend. If the price is at a resistance or support, or if the price makes all-time highs or lows, and the tweezer pattern appears, then there is a high probability of trend reversal. A tweezer can take the body of another reversal candlestick pattern. This gives a stronger signal.
What is a morning star candlestick pattern?
The morning star pattern is a triple-candlestick pattern that appears in downtrend. In this pattern, the first candle is always a large bearish candle that is followed by a small candle, which can be either bearish or bullish, and ideally, it does not touch the first candle, and then it comes the large bullish candle that pierces deep into the first bearish candle. The third candle shows that the buyers had managed to take control over the price and that a reversal of trend may follow. That is why this pattern is considered a bullish reversal pattern.
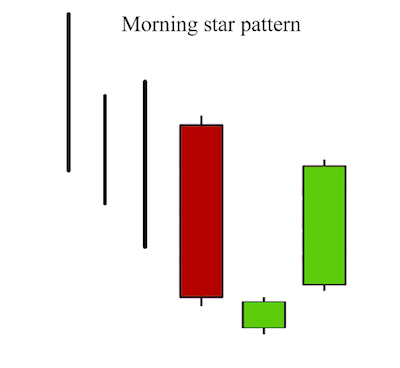
The ideal morning star pattern should have a gap between the second and the third candles, although, not having a gap does not weaken the pattern, especially in markets that rarely have gap openings, such as the forex market. According to Steve Nison, the decisive factor for this pattern is the middle candle that should be a spinning top.
A variant of this pattern is the morning star doji pattern where the middle candlestick is a doji instead of a spinning top.
What is an evening star candlestick pattern?
The evening star pattern is the opposite of the morning star. This pattern appears in an uptrend, and it signalizes a top reversal. The evening star is always made of three candles: the first is a long bullish candle, the second can be both bullish or bearish with a small body, almost like a spinning top, and the third candle is always a long bearish candle, which pierces deep within the first. The third candle carries most weight for this pattern, depending on how far it intrudes into the first candle.
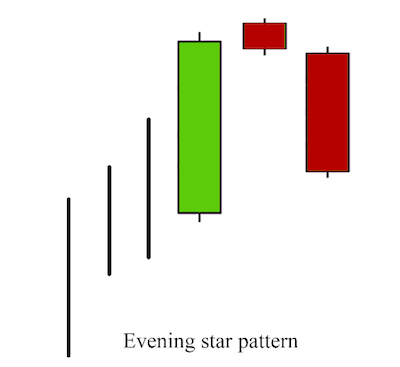
A variant of this pattern is the evening star doji pattern where the middle candle is a doji instead of a spinning top.
What is a three black crows candlestick pattern?
The three black crows pattern is made of three consecutive bearish candles where each candle has opened lower than the previous and closed lower than the previous. The pattern indicates a strong reversal of the uptrend.
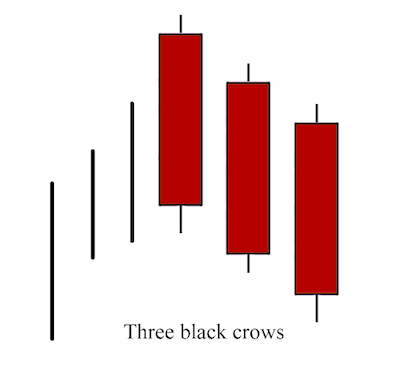
The three black crows pattern is mostly used by long-term traders as it takes three sessions to unfold.
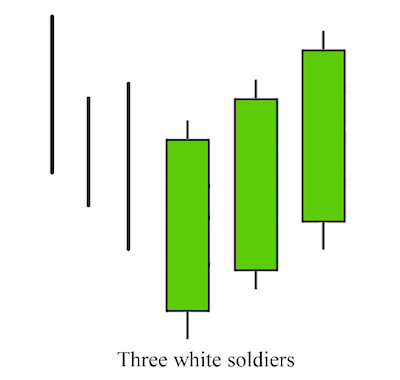
What is a three white soldiers candlestick pattern?
The three white soldiers pattern is the opposite of the three black crows. In this case, every candle is a long bullish candle and every consecutive candle has opened higher than the previous and closed higher than the previous. The three white soldiers suggest a possible downtrend reversal.
Conclusion
Candlestick charts are without a doubt one the most powerful tools that a trader can own. The candlestick patterns that often appear are easy to spot, and they have relatively high success rates in predicting trend reversals. It is no wonder then that today, the candlesticks have become a charting standard.
But sometimes these pattern interpretations can be subjective, especially if the pattern is not a text-book one. And just like any other charting indicator, candlestick patterns are not 100 percent reliable. That is why many traders prefer to use a combination of technical indicators and candlestick patterns.