

Market Geometry and its Implications
Market geometry or price action trading refers to interpreting a chart without using any technical indicators. It all starts with a pure, naked chart, and traders use tools like trendlines, horizontal and dynamic support and resistance levels, and channels amoungst other tools to read into the future price action.
The idea is to project levels further in time so that traders are aware of possible places where the market may hesitate, or have a difficult time breaking. Or simply where the price will be attracted.
In Forex trading, technical analysis plays an important role, and its effectiveness is seen especially when using market geometry techniques. Moreover, the bigger timeframes are more relevant, due to the fact that support and resistance are difficult to break.
Because there are no specific rules on how to use market geometry, it all starts with common sense and a naked chart.
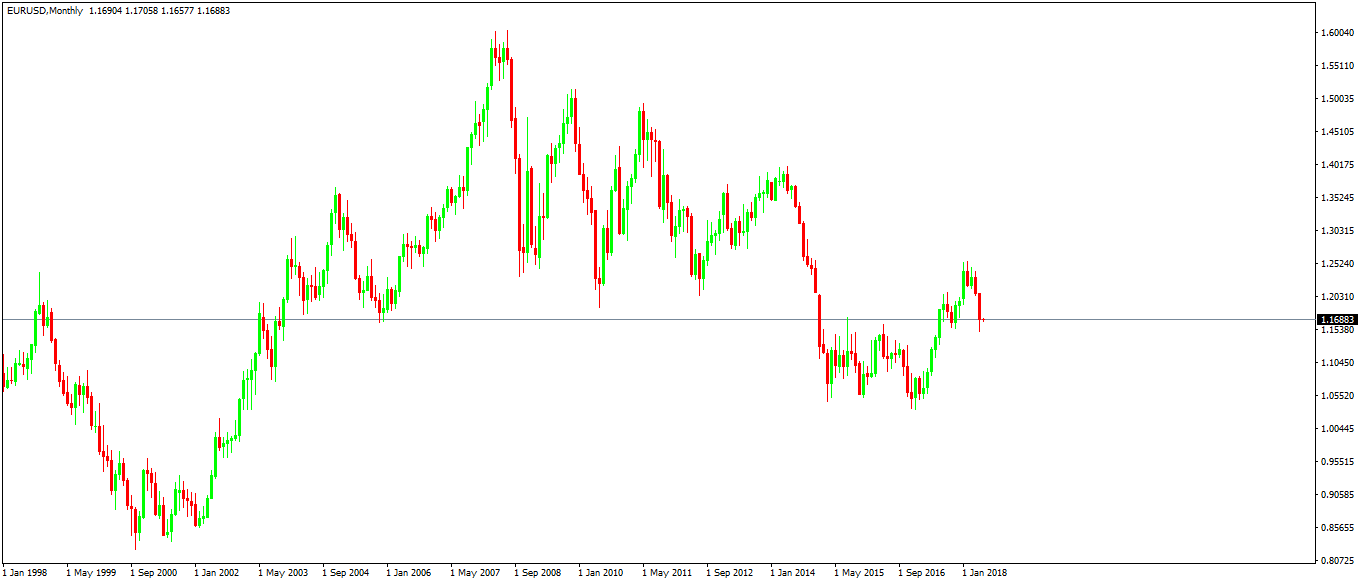
This is our intention here too. And the currency pair we will use to demonstrate the effectiveness of market geometry is the EURUSD on the monthly timeframe.
Support and Resistance in Forex Trading
One of the basic concepts in technical analysis, support and resistance come in two types: horizontal and dynamic.
As the name suggests, horizontal support or resistance forms on the horizontal and doesn’t refer to a particular level. Because Forex trading is characterized by huge volatility, support and resistance refers to an area where the price hesitated in the past. Projecting that area in the future, traders expect a future reaction.
One of the important rules to note when interpreting support and resistance is that the levels change. Once broken, support becomes resistance, and resistance becomes support.
A dynamic level refers to support and resistance that follow the price action. Think of a rising or falling trendline, channel, and the price hesitating around it.
When both dynamic and horizontal meet in the same area, it is said that the market forms a confluence area, even more difficult to break.
Market geometry or price action analysis is impossible without a clear understanding of support and resistance concepts.
Fibonacci In Market Geometry Analysis
It all starts with marking the highest and the lowest point on a chart with two horizontal lines. Next, depending on the current price action, draw a Fibonacci retracement ratio to find out essential levels like 23.6%, 38.2%, 50% and 61.8%.
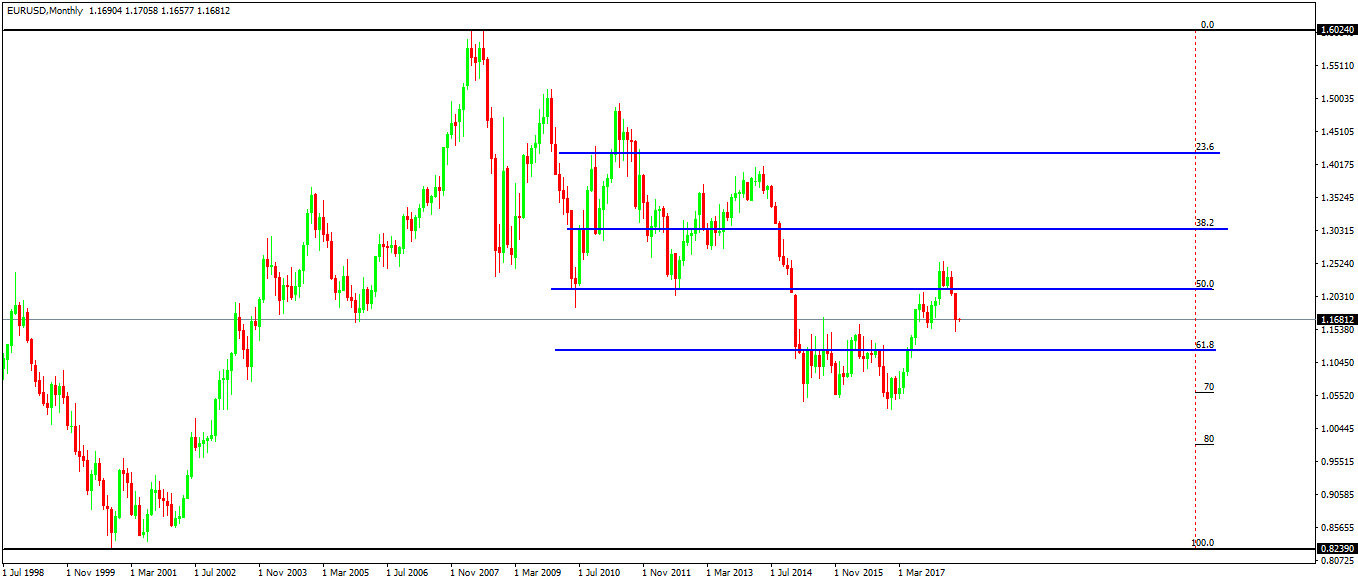
In the EURUSD case, the market is in a bearish trend since the 2008 financial crisis. Hence, the Fibonacci tool reflects the possible support levels first.
After placing the Fibonacci, pick only the level/levels where the market used to hesitate. Irrelevant price action around other levels should simply be ignored.
In this case, the 50% level is the relevant one, and that’s what we take moving forward with the market geometry analysis. Therefore, just clean the chart from the irrelevant levels and stick with the ones that matter.
In doing that, we see that on its move lower, the EURUSD pair hesitated twice on the 50% level. In fact, the area proved to be strong support, hence projecting it on the right side of the chart makes sense.
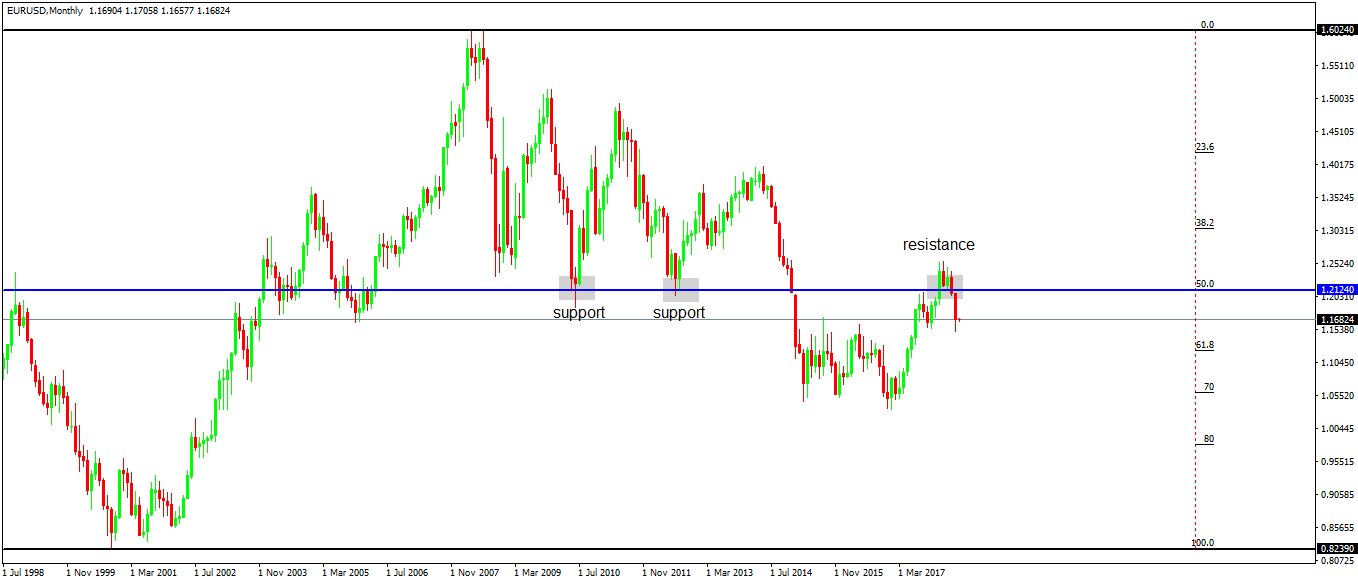
Eventually, the price action broke the support area, and it is no wonder. A quick look at the series of lower highs suggested that the pair is unable to break higher. Naturally, it’ll test the support again.
In 2014 the ECB (European Central Bank) started to ease the monetary policy aggressively. First by cutting the key interest rate level, and then by adding other easing measures like LTRO (Long Term Refinancing Operations) and QE (Quantitative Easing). The process culminated in dropping the interest rate level to negative territory.
It created a bearish sentiment seen in all Euro pairs. The inability of the EURUSD to break the lower highs series sent it straight through the classic support level.
However, after breaking it, the support that held two times in the past becomes resistance to any future price action.
As the chart shows, three years after the support broke, the EURUSD turns to the classic resistance. And, it was strongly rejected.
Confluence Areas in Market Geometry
Confluence areas are common in Forex trading, as retail traders mostly use technical analysis to buy or sell a currency pair. Moreover, they tend to interpret multiple indicators, and when more than one shows the same thing, they use it as a confirmation for the future direction.
Regarding support and resistance, when the price meets both horizontal and dynamic levels, that’s a confluence area challenging to break. It just so happened, that the EURUSD met such an area and traders using market geometry knew it would have a hard time to break it.
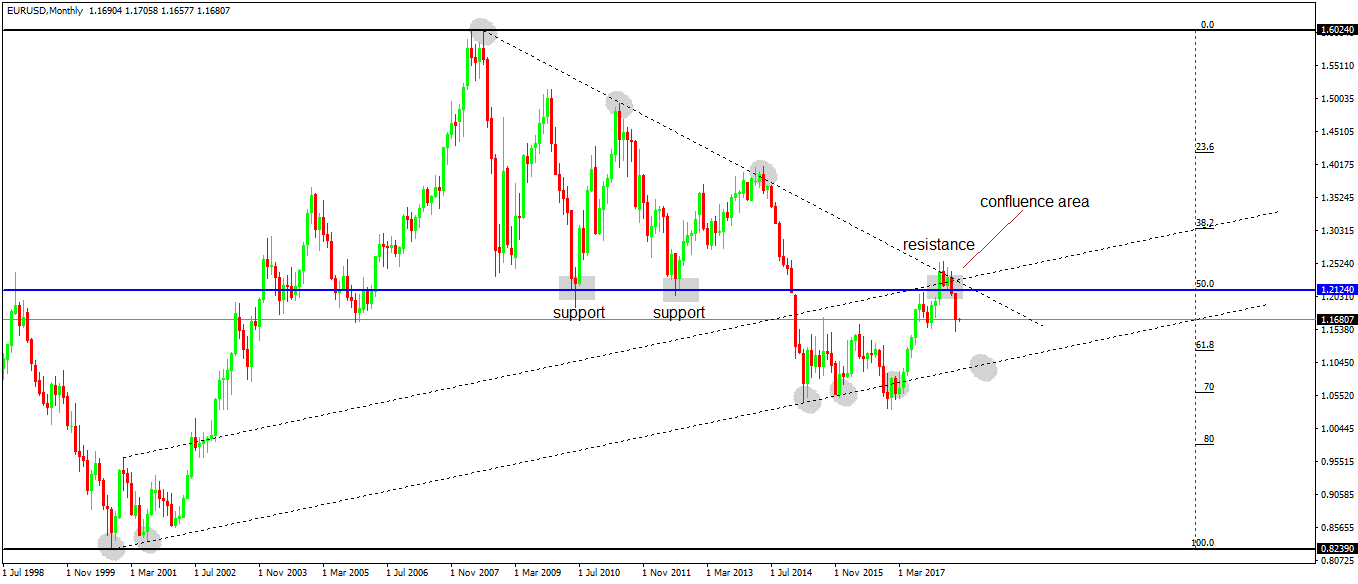
From left to right, it all starts with connecting the absolute low with the next higher low. In a bullish trend, this higher highs and higher lows series gives the perfect solution for drawing a trendline and then projecting it to find future dynamic support and resistance levels.
In this case, the projection on the right side of the chart shows the price hesitating to the dynamic support three times before turning to classic resistance.
Moreover, projecting the rising trendline from the previous bearish trend’s lower high, results in another resistance level, this one dynamic, further increasing the chances of a strong pullback.
Applying the same principle on the bearish trend, we see that the classic resistance forms in the same area with the dynamic resistance. Hence, a confluence area was in place months or even years before the price actually hit it.
Considering the big timeframe and the confluence area, savvy traders knew it is not wise to stay on the long side anymore. If anything, it was a great place to short.
Conclusion
The rules explained here are valid for all timeframes. The only thing that changes is the strength of the resulting levels.
As traders go on lower timeframes, the levels will provide less support or resistance on future price action.
What’s important to note is that price action applies to all types of traders: scalpers, swing traders or investors.
To sum up, market geometry or price action trading uses support and resistance levels. These ones, in turn, come dynamically and horizontally.
Ideally, traders find confluence areas, where the price meets more than one support or resistance level. When that happens, the price is likely to hesitate and turn, making room for great risk-reward ratios.
The beauty of price action trading is that it uses common sense and simple trading tools like trendlines and levels. Anyone can do that, and the fact that the market reacts to such levels is nothing short of amazing.
In the EURUSD case, the dynamic and classic resistance projected using market geometry was known well in advance:
- the rising trendline comes from connecting two points in 1999 and 2001
- the falling one from connecting two points in 2008 and 2010
- the classic support is there from at least 2010
And the market reached that level in 2018. How about that for a Forex trading forecast?