Fibonacci Trading
by Avramis Despotis ago. 03, 2019

If you're new to the world of Forex trading, you could easily be overwhelmed by the number of trading styles and strategies that can be used to profit on the Forex market. And the truth is that there are a number of Forex trading strategies that can be profitable; the difference comes in finding a strategy that works for you and that you can understand, as well as one that is profitable. The Fibonacci Forex trading strategy is one that has been touted by experts in currency exchange for years, and can be useful for even beginner traders who are looking to enter the market with a big impact. Fibonacci Forex trading is currently being used by traders both on the thousand and billion dollar levels, and an education in Fibonacci Forex trading can be a great backbone for traders all around the globe at any price point. But what is the Fibonacci method, and how can you incorporate it into your trading strategy?
Fibonacci was an Italian mathematician who is best known for the development of the "Fibonacci sequence," which describes a rippling effect that is seen when a series of numbers forms the sum of the two beneath it. You've probably studied the Fibonacci sequence when you were in high school mathematics; a sample sequence would go something like 1, 1, 2, 3, 5, 8, 13, 21, 34, etc. The Fibonacci sequence has been used to develop a number of mathematical theories, and the pattern has even been observed taking place in both natural and manmade structures and developments thanks to its oscillating effect. However, for Forex trading investors, it's more important to think about Fibonacci sequences in terms of the dividends and margins that they see when deciding how a currency or currency pair will fluctuate in value. The reason that the Fibonacci sequence is so extraordinarily useful is because the pattern of fluctuation has been observed in the areas on physics, natural artwork, as well as economics; it's a common way to predict how currency will move, and you can use the sequence to make informed decisions on when to sell and buy your currencies of choice. Fibonacci ratios, derived from sequences (for example, 236, .50, .382, .618, etc. to use the above instance) have the advantage of being able to be calculated ahead of time. This gives traders an inherent advantage, because when they go into the next trading day, they will already have an idea of when the best times to buy and sell will be if their currency values begin to fall into the oscillating pattern of the Fibonacci sequence.
What are Fibonacci numbers?
Fibonacci numbers is a mathematics term, which refers to numbers following a sequence, called a Fibonacci sequence. Every number in this sequence is the sum of the previous two numbers. For example:
0, 1, 1, 2, 3, 5, 8, 13, 21, 34, 55, 89, 144, 233, … to infinity.
There is a constant within the series as it progresses toward infinity. This constant is called the Golden Ratio or Golden Mean with a value of 1.618. In Fibonacci numbers you can get the Golden Ratio by dividing each number (later in the sequence) by the previous number. For example, 89 / 55 = 1.618, 144 / 89 = 1.618, 233 / 144 = 1.618, and so on. The inverse value of the Golden Ratio is 0.618, for example 55 / 89 = 0.618, 89 / 144 = 0.618, etc.
The Golden Ratio can also be found in architecture and in nature. In architecture the ratio is called the golden rectangle as it is pleasing to the eyes. In nature the ratio is present in the arrangement of stems in flowers, in the nautilus shell, in the branching of trees, in the family tree of honeybees, and in many other places.
A brief history of Fibonacci numbers
The Fibonacci sequence was introduced to the Western world by the Italian mathematician Leonardo de Pisa, known by his nickname as Fibonacci. In his book Liber Abaci (The book of Calculation) from 1202, Leonardo de Pisa described the Hindu-Arabic numbers by addressing their functionality in commercial purposes and in mathematical context. Before that, everyone in Europe used the Roman numerals, which made modern mathematics impossible at the time.
Fibonacci noted the sequence when working out a mathematical problem about rabbit breeding where he was tasked in finding out how fast rabbits could breed in ideal circumstances. The answer he got was the Fibonacci sequence. But unlike the modern use of the Fibonacci sequence where it starts with 0, Leonardo de Pisa started the sequence with the number 1.
Fibonacci numbers in trading
Fibonacci indicators are used in charting techniques throughout the world in predicting price movements of various trading instruments. Almost every charting software today has Fibonacci indicators in their selection.
There are six types of price relationships, i.e. indicators, with the Fibonacci numbers. Those are:
- Fibonacci retracements
- Fibonacci extensions
- Fibonacci expansions
- Fibonacci time zones
- Fibonacci arcs
- Fibonacci fans
The main purpose of Fibonacci indicators in trading is to show possible support and resistance zones, and to predict possible price reversals. These indicators can be used on any time frame on any instrument using a charting software.
Fibonacci price retracements
Fibonacci retracements are a technical indicator with the goal to detect possible support or resistance zones during a corrective wave within a trend. These price retracements can be created on any trading software when you click on the Fibonacci indicator and then click on the lowest price point and then drag the cursor over to the highest price point during an uptrend, or you start from the highest price point and then drag the cursor to the lowest price point in a downtrend. The result is an automatically drawn horizontal support line to where the price will probably retrace. This usually happens after a significant price move. Fibonacci retracements show these levels on the charts, based on the Fibonacci ratios: 0.236, 0.382, 0.50, 0.618, and 0.786.
Surprisingly, these levels show high price congestions.
The retracements are also called alert zones, meaning they don’t necessarily act as hard reversal points, but only to alert for possiblereversal.
Retracements that have 100 percent pullback mean that the entire trend has been reversed. This happens in short term trends where prices are driven by news. All other smaller retracements (38 percent, 50 percent, etc.) are common during trends.
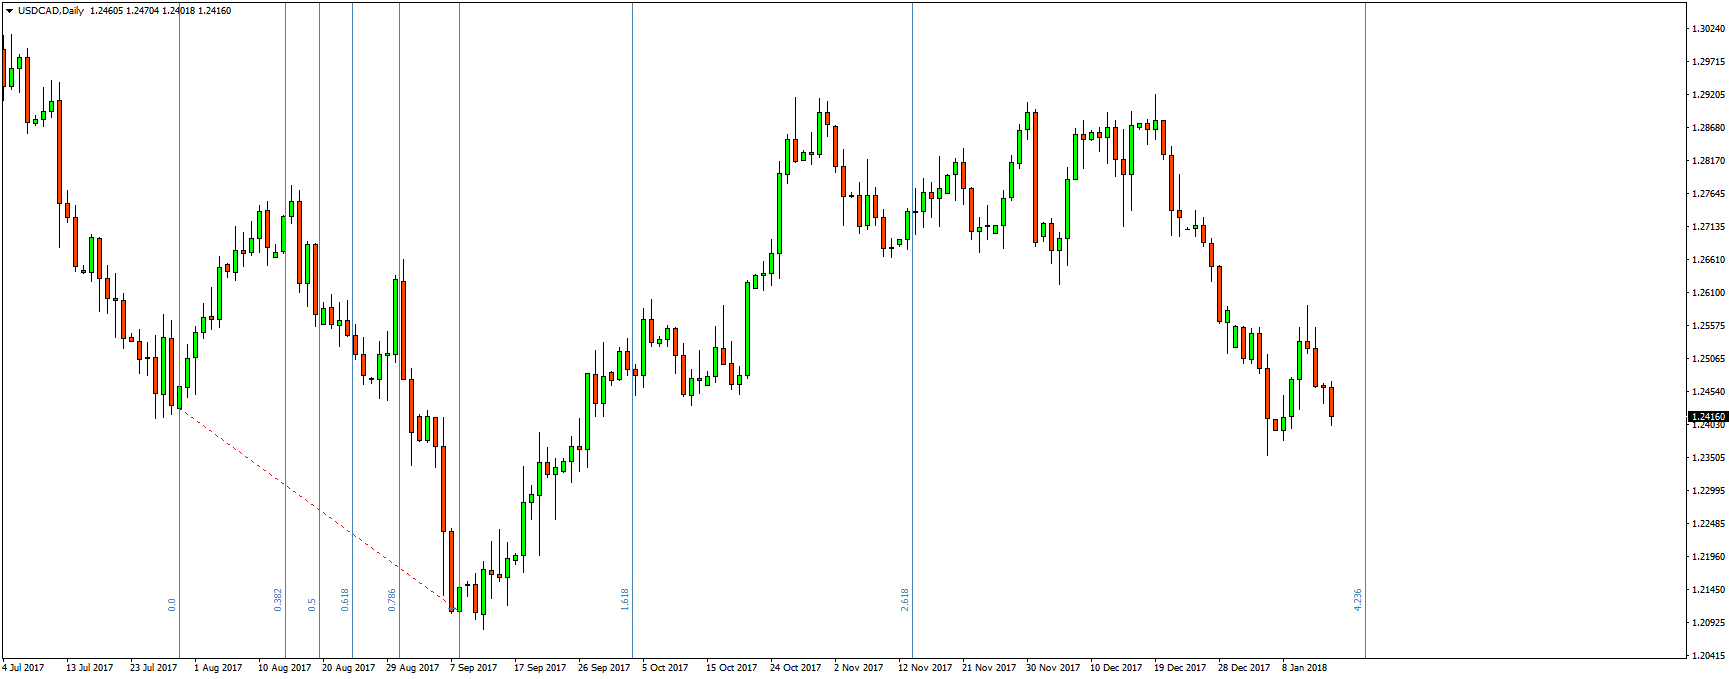
In this USD/CAD daily chart, the Fibonacci retracements are drawn from the low price point to the high (as this is an uptrend).
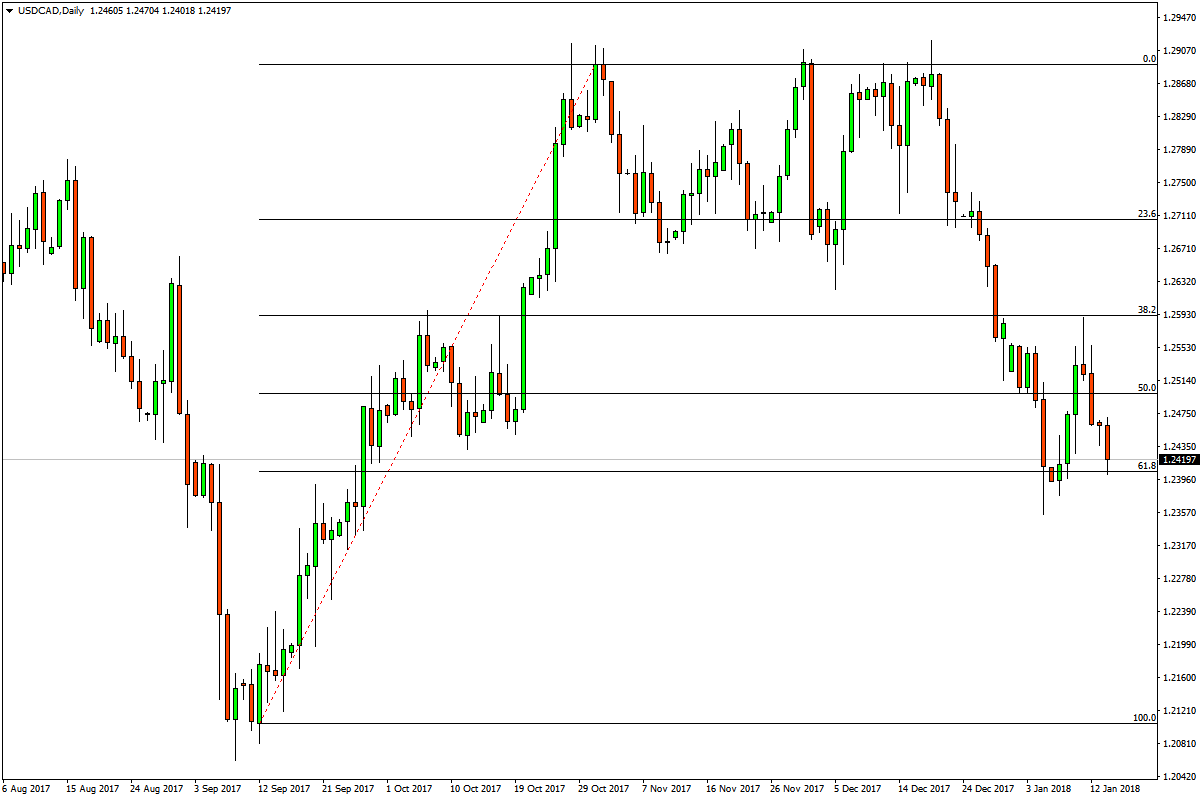
You can see that the price retraced to the Fibonacci number 0.236, which in other words is 23.6 percent retrace from the trend, and for a while the price was stuck in a range between the highest price point reached during the trend and the 0.236 level. After the support level failed to hold the price, the next level was 0.50, or 50 percent retrace, and then 0.618 level.
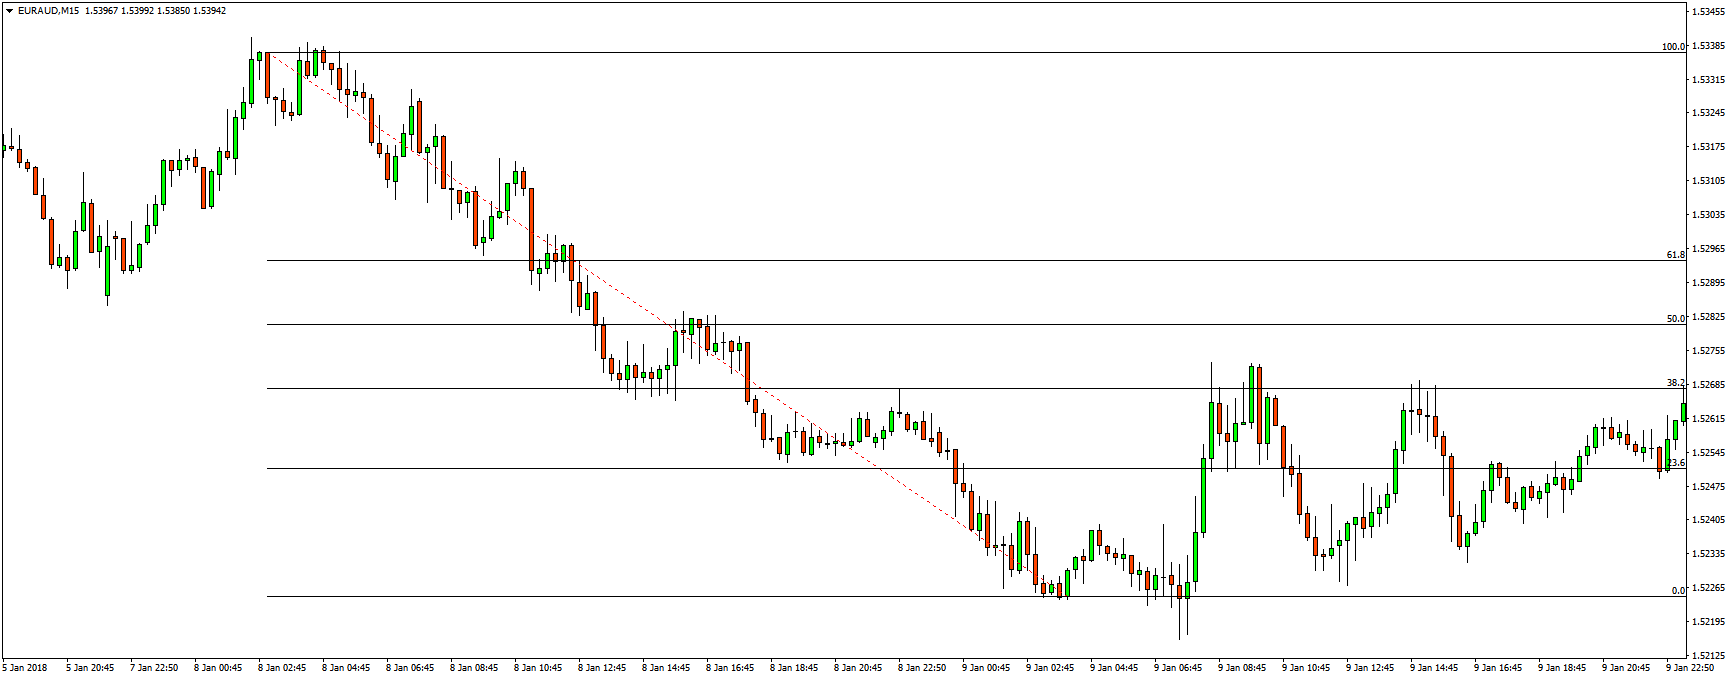
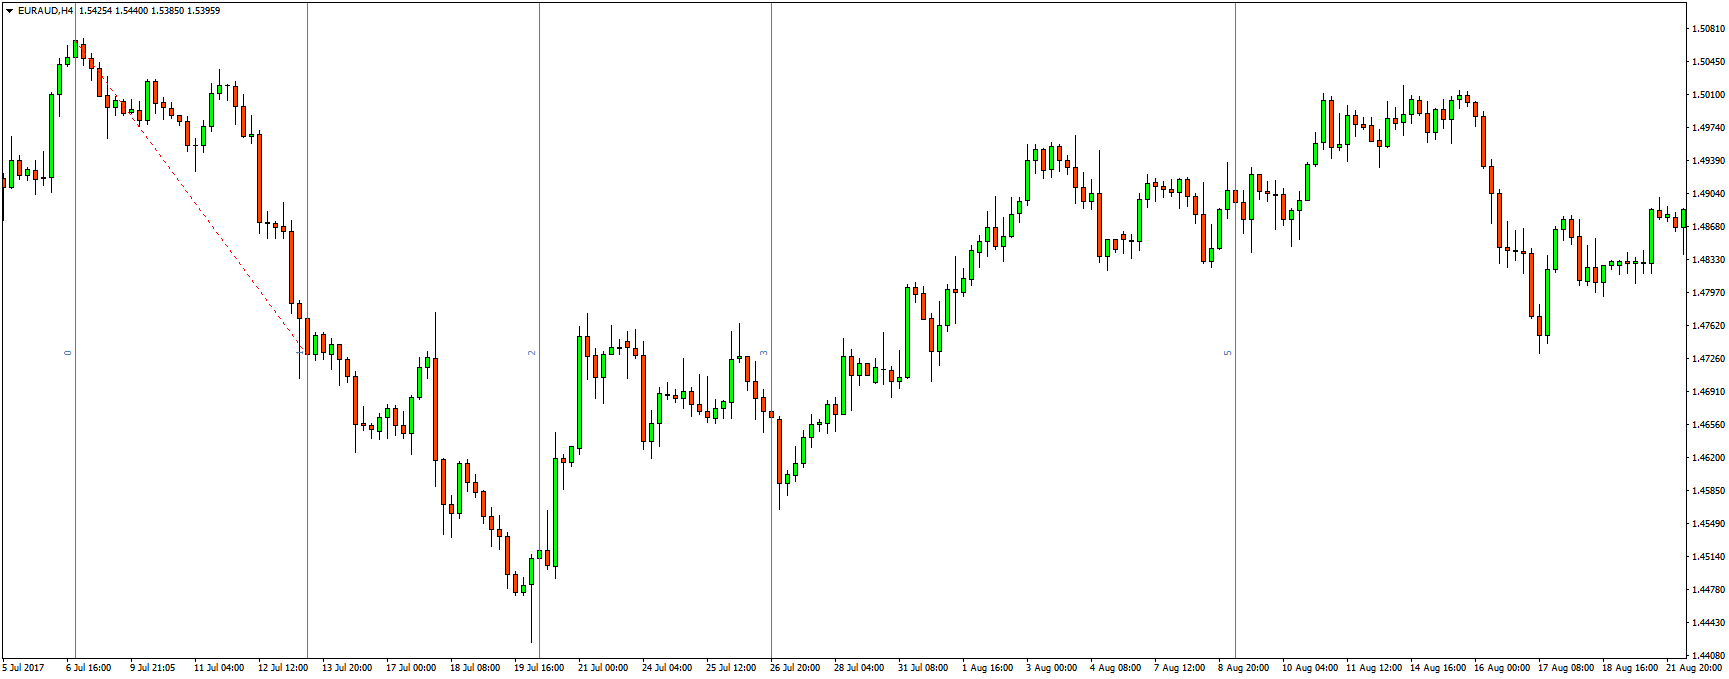
In this EUR/AUD M15 chart, the Fibonacci retracements are drawn in a downtrend where the price retreated to the 0.382 level (38.2 percent retrace), which for a long time remained as a price resistance zone.
Fibonacci price extensions
Fibonacci price extensions are similar to price retracements. The difference between the two is that price swings in price retracements are less than 100 percent of the trend, while price swings in price extensions extended beyond 100 percent. In other words, extensions show possible support and resistance zones beyond the trend.
The ratios used in Fibonacci price extensions are: 1.272, 1.618, 2.618, and 4.236.
On the MetaTrader 4 platform, Fibonacci extensions are drawn with the Fibonacci retracement tool by clicking on the highest price point and dragging the mouse cursor to the lowest price point for price extensions in an uptrend (basically doing the Fibonacci retracements in reverse), and by clicking on the lowest price point and dragging the cursor to the highest price point in a downtrend.
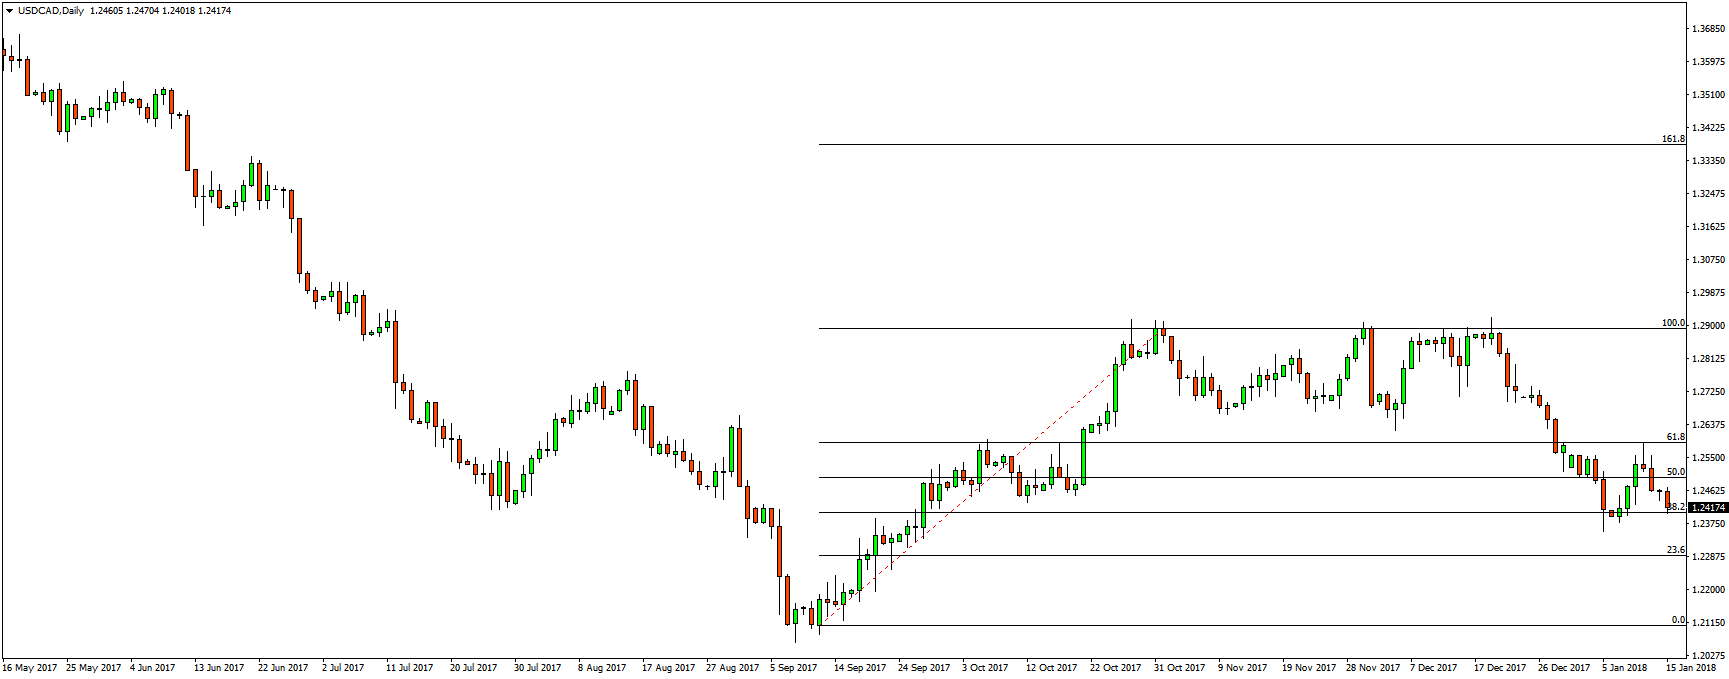
Otherwise, the extensions won’t appear on the chart. The extensions are mostly used when the price is at new highs or new lows, and when there are no clear support and resistance zones in sight. With the extensions, the trader can get an approximate zone of where the price may stop.
Fibonacci expansions
Fibonacci expansions, also called, Fibonacci price projections are another support and resistance indicator. But unlike retracements and extensions, the price projections are run from three data points. These expansions compare swings in the same direction.
Fibonacci expansions are useful as they predict future price moves where the price has not yet been reached. That is why traders use price expansions for deciding on profit taking targets during trends. Fibonacci expansions are drawn by connecting three points. In an uptrend you connect the lowest price point from where the trend started, with the highest price point that the trend has reached, and then connect the third point with the retracement.
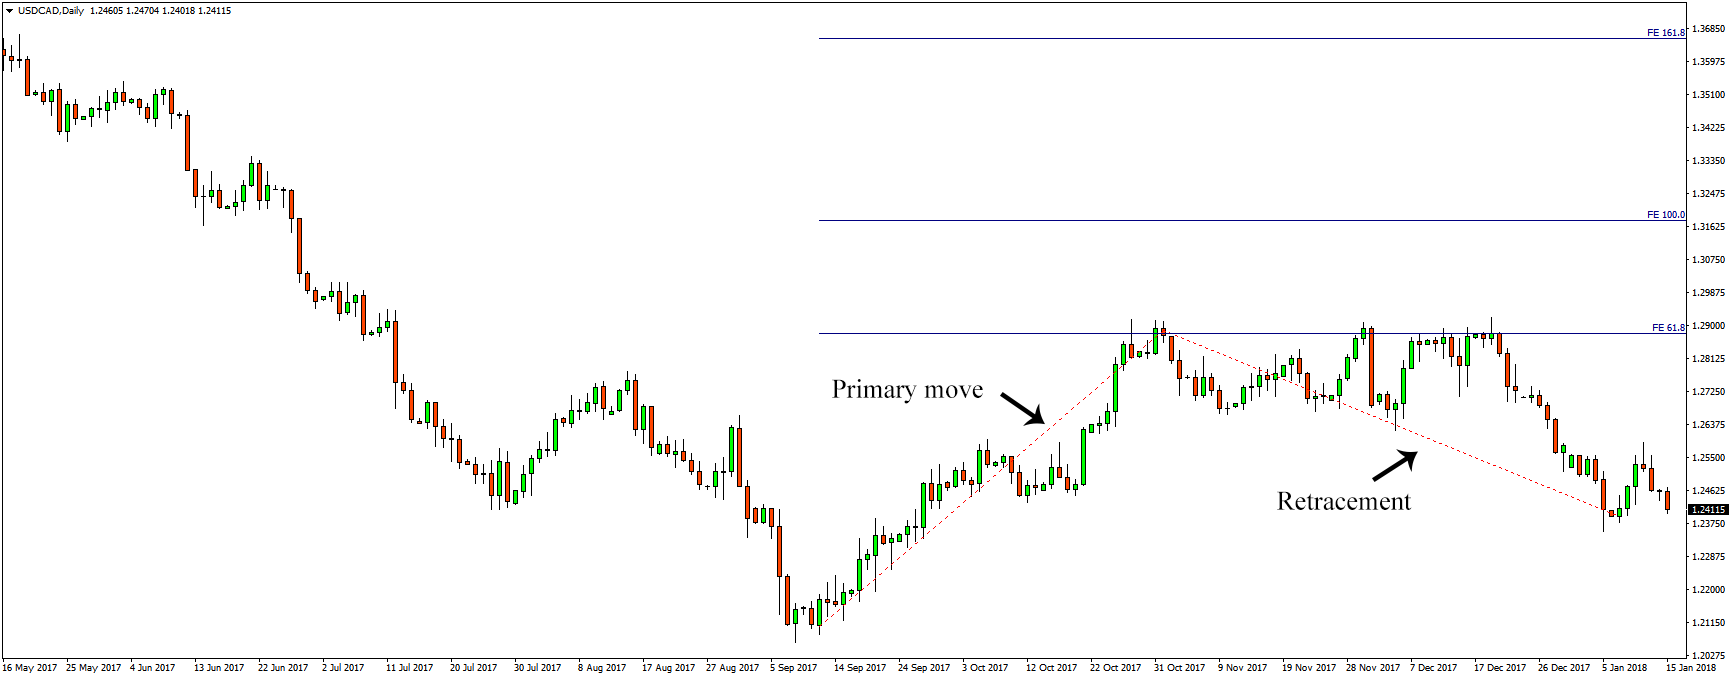
In a downtrend, you connect the highest price point with the lowest price point and then with the retracement. Once you connect all three points, you get an extension of resistance zones beyond the highest price point. The resistance zones that appear on the chart, usually coincide with historical support/resistance zones if the price had reached that point in the past.
Fibonacci time zones
Unlike price retracements and extensions, Fibonacci time zones are vertical lines, based on the Fibonacci numbers sequence. You can draw these lines by connecting:
- Low to low price points
- Low to high price points
- High to low price points
- High to high price points
These lines are spaced at the intervals 1, 2, 3, 5, 8, 13, 21, and so on. However, for better results you should manually adjust these values not as Fibonacci numbers, but as the Golden Ratio numbers, the same numbers that Fibonacci retracements use: 0.382, 0.618, 1, 1.618, 2.618, etc.
The goal with Fibonacci time zones is to predict price reversals based on time and not to predict support and resistance levels. The lines extended into the future.
Some traders consider Fibonacci time zones as an indicator that hardly predicts price moves, therefore they consider this indicator less important than retracements and extensions.
Fibonacci arcs
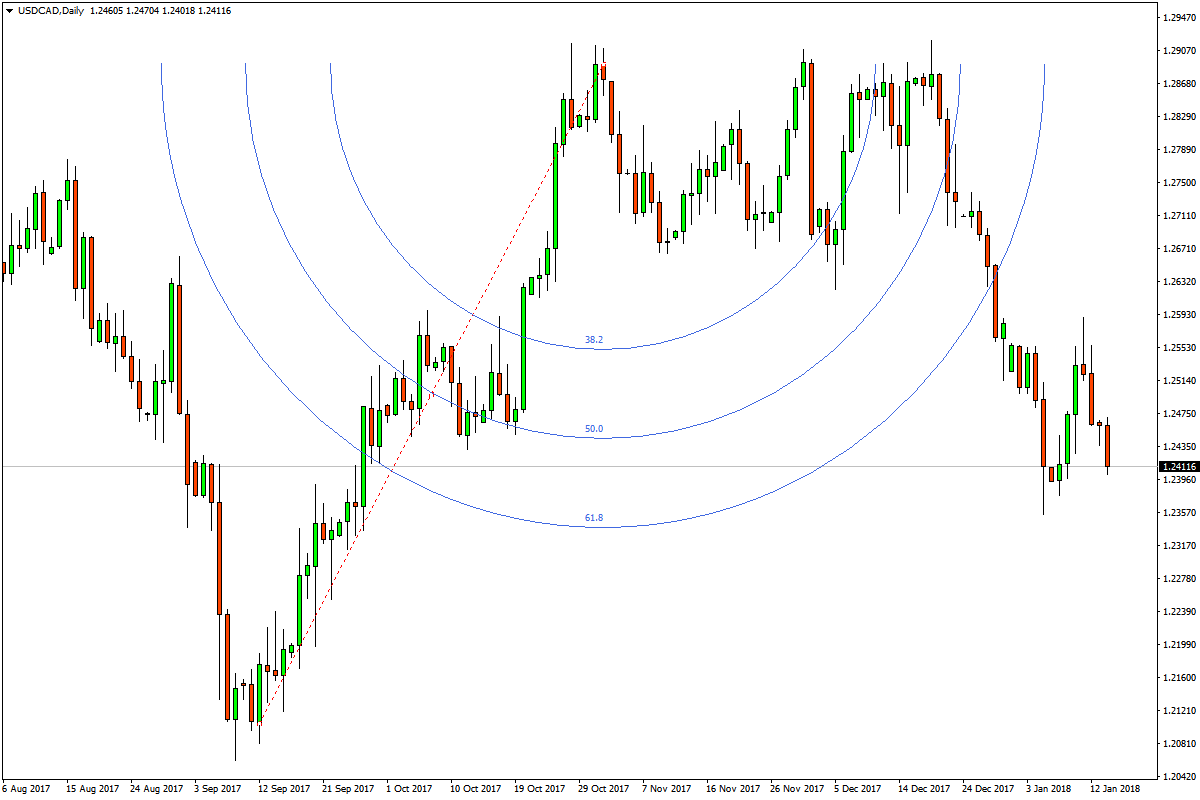
Fibonacci arcs look like half circles on the chart. They are drawn by connecting two extreme price points. For example, the highest high and the lowest low in a downtrend, or the lowest low and the highest high in an uptrend. By default, three arcs will appear on the chart. The first and the third arcs are based on the Fibonacci ratios 0.382 and 0.618, while the second arc is 0.50. The line connecting the highs and lows is called the Base Line.
Just like Fibonacci retracements and extensions, the goal of Fibonacci arcs is to mark potential support and resistance zones. But unlike the previous two, Fibonacci arcs also add a time element to retracements.
If the price movement is over a longer period of time, the arcs look wide. The inverse is also true, if the price movement is over a shorter period of time, the arcs are narrow.
As the price approaches these arcs, we can anticipate that the price will either break the support/resistance or bounce off of these levels.
Since Fibonacci arcs are rarely followed by the majority of traders, those who use them call the levels drawn by the arcs hidden levels.
TIP: When drawing Fibonacci arcs on the Meta Trader 4 platform, the lines on the chart will appear flat like Fibonacci retracements (if you draw Fibonacci retracements, both lines from the arcs and the retracements will overlap). To make the arcs arc you have to change scale in Parameters tab in the settings to 100 (default value is 1).
Fibonacci fans
Fibonacci fans are another technical indicator based on the Fibonacci sequence. Like all of the Fibonacci-based indicators, Fibonacci fans are drawn by connecting a low price point with a high price point during an uptrend, and by connecting a high price point with a low price point during a downtrend. Three diagonal trend lines are then automatically drawn on the chart. The three ratios used in Fibonacci fans are 0.382, 0.50, and 0.618.
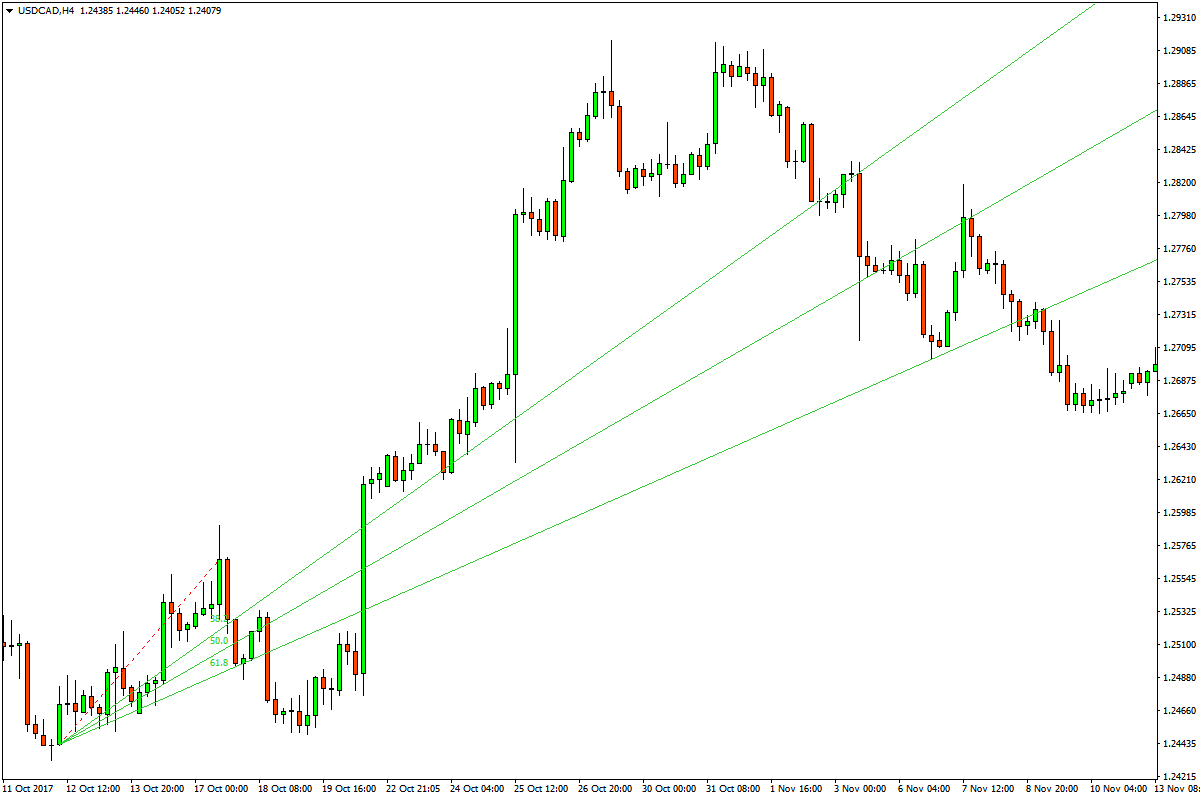
This indicator is primarily used for analyzing trends, i.e. to show support and resistance levels within a trend channel.
Fibonacci numbers used as moving averages
Since Fibonacci sequence is heavily used in trading, it can also be used as numbers for the Moving Average indicators. Especially the numbers 13, 21, 34, and 55. Some traders use 13-week averages on the weekly chart. Moving averages perform better in trending markets and perform poorly in ranging markets. However, like most indicators, moving averages are lagging indicators, which means that they are based on past prices. That is why moving averages should be used in addition to other charting indicators.
Conclusion
All Fibonacci indicators are based on anticipating changes in trends by showing potential support and resistance zones, either during a corrective wave or during a trend extension. They work on all trading instruments and are available on most charting software.
However, Fibonacci indicators should be used in addition with other charting indicators or by simply combining two or more Fibonacci indicators to get stronger signals.